Holiday Inn 2010 Annual Report Download - page 107
Download and view the complete annual report
Please find page 107 of the 2010 Holiday Inn annual report below. You can navigate through the pages in the report by either clicking on the pages listed below, or by using the keyword search tool below to find specific information within the annual report.-
 1
1 -
2
-
3
-
4
-
5
-
6
-
7
-
8
-
9
-
10
-
11
-
12
-
13
-
14
-
15
-
16
-
17
-
18
-
19
-
20
-
21
-
22
-
23
-
24
-
25
-
26
-
27
-
28
-
29
-
30
-
31
-
32
-
33
-
34
-
35
-
36
-
37
-
38
-
39
-
40
-
41
-
42
-
43
-
44
-
45
-
46
-
47
-
48
-
49
-
50
-
51
-
52
-
53
-
54
-
55
-
56
-
57
-
58
-
59
-
60
-
61
-
62
-
63
-
64
-
65
-
66
-
67
-
68
-
69
-
70
-
71
-
72
-
73
-
74
-
75
-
76
-
77
-
78
-
79
-
80
-
81
-
82
-
83
-
84
-
85
-
86
-
87
-
88
-
89
-
90
-
91
-
92
-
93
-
94
-
95
-
96
-
 97
97 -
 98
98 -
 99
99 -
 100
100 -
 101
101 -
 102
102 -
 103
103 -
 104
104 -
 105
105 -
 106
106 -
 107
107 -
 108
108 -
 109
109 -
 110
110 -
 111
111 -
 112
112 -
 113
113 -
 114
114 -
 115
115 -
 116
116 -
 117
117 -
118
-
119
-
120
-
121
-
122
-
123
-
124
 |
 |
OVERVIEW BUSINESS REVIEW
THE BOARD,
SENIOR MANAGEMENT AND
THEIR RESPONSIBILITIES
GROUP FINANCIAL
STATEMENTS
PARENT COMPANY
FINANCIAL STATEMENTS USEFUL INFORMATION
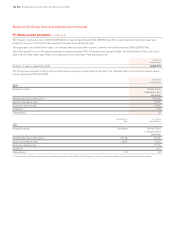
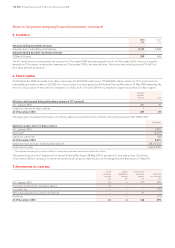
27. Share-based payments continued
Movements in the awards and options outstanding under the schemes are as follows:
Annual Bonus Long Term
Plan Incentive Plan
Number of shares Number of shares
thousands thousands
Outstanding at 1 January 2009 1,289 11,153
Granted 1,059 5,755
Vested (434) (3,124)
Lapsed or cancelled (60) (1,518)
Outstanding at 31 December 2009 1,854 12,266
Granted – 2,603
Vested (580) (1,500)
Lapsed or cancelled – (2,027)
Outstanding at 31 December 2010 1,274 11,342
Fair value of awards granted during the year
2010 n/a* 1,181.9¢
2009 735.6¢ 414.1¢
Weighted average remaining contract life (years)
At 31 December 2010 0.7 1.0
At 31 December 2009 1.3 1.3
* No awards were granted during the year.
The above awards do not vest until the performance and service conditions have been met.
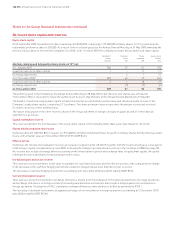
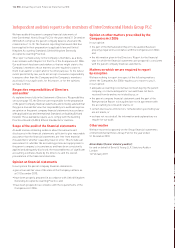
Sharesave Plan Executive Share Option Plan
Weighted Weighted
Number Range of average Number Range of average
of shares option prices option price of shares option prices option price
thousands pence pence thousands pence pence
Outstanding at 1 January 2009 49 420.5 420.5 7,635 308.5-619.8 486.3
Exercised (48) 420.5 420.5 (1,518) 308.5-619.8 496.2
Lapsed or cancelled (1) 420.5 420.5 (247) 438.0-619.8 509.9
Outstanding at 31 December 2009 – – – 5,870 308.5-619.8 482.8
Exercised – – – (2,497) 349.1-619.8 478.6
Lapsed or cancelled – – – (82) 349.1 349.1
Outstanding at 31 December 2010 – – – 3,291 308.5-619.8 489.3
Options exercisable
At 31 December 2010 – – – 3,291 308.5-619.8 489.3
At 31 December 2009 – – – 5,870 308.5-619.8 482.8
Included within the options outstanding under the Executive Share Option Plan are options over 902,412 (2009 2,001,060, 2008 2,424,605) shares that have not been recognised
in accordance with IFRS 2 as the options were granted on or before 7 November 2002. These options, relating to former Six Continents share schemes, have not been subsequently
modified and therefore do not need to be accounted for in accordance with IFRS 2.
The weighted average share price at the date of exercise for share options vested during the year was 1063.8p. The closing share price on
31 December 2010 was 1243.0p and the range during the year was 887.0p to 1266.0p per share.
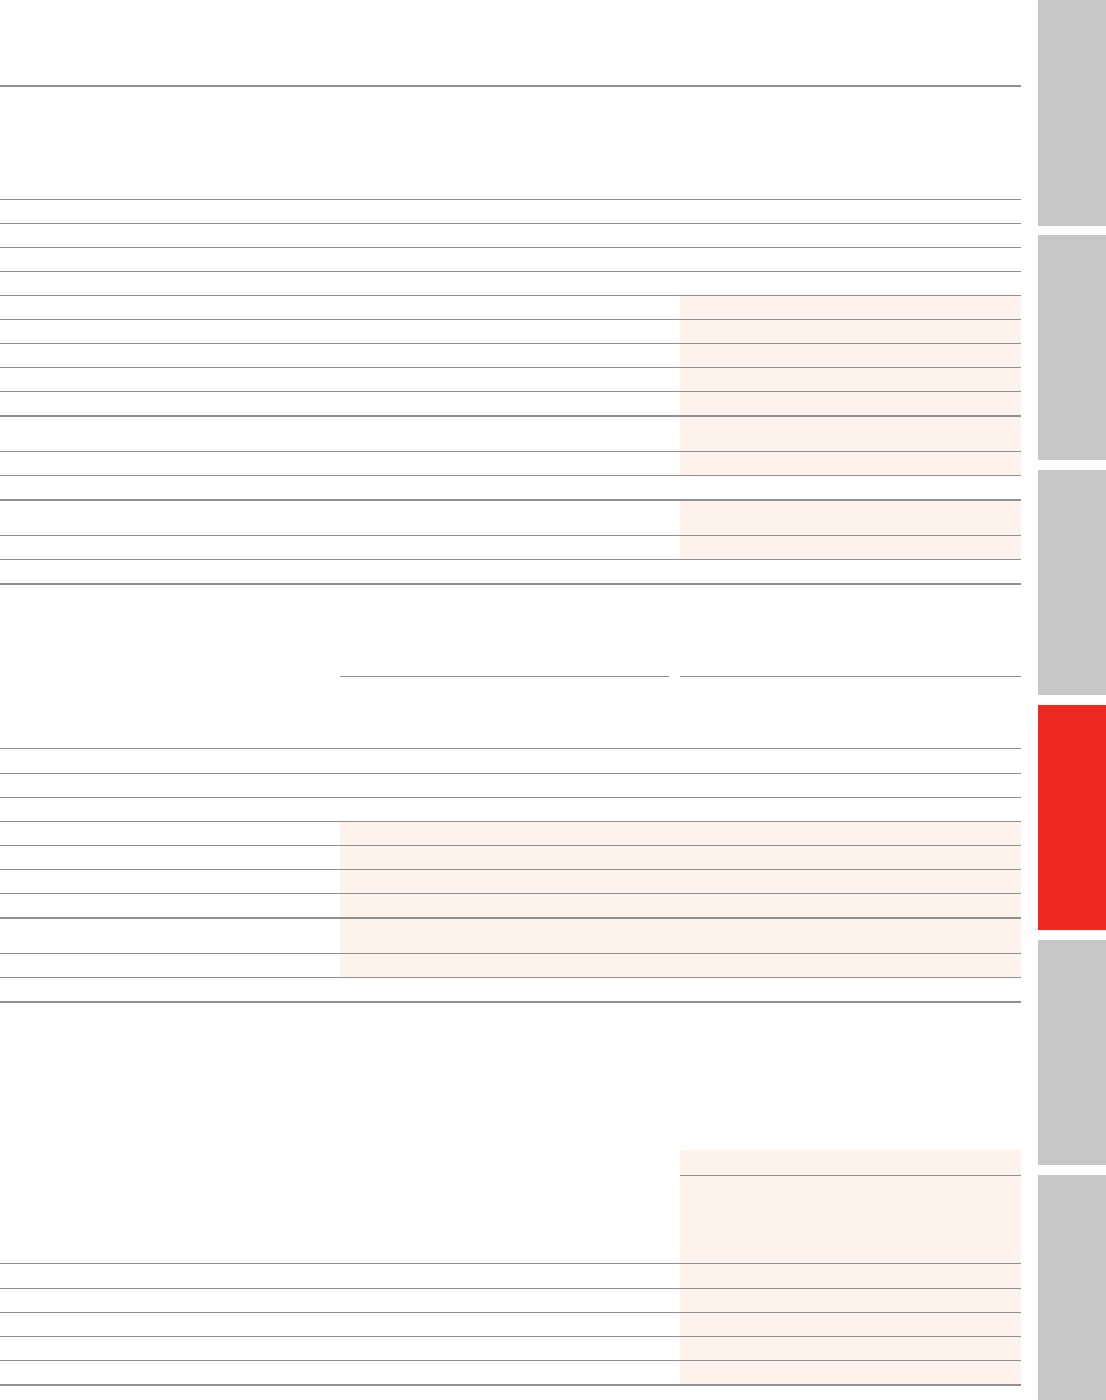
Summarised information about options outstanding at 31 December 2010 under the share option schemes is as follows:
Options outstanding and exercisable
Weighted
average Weighted
Number remaining average
outstanding contract life option price
Range of exercise prices (pence) thousands years pence
Executive Share Option Plan
308.5 12 1.8 308.5
422.8 to 494.2 2,676 2.4 460.7
619.8 603 4.3 619.8
3,291 2.7 489.3
Notes to the Group financial statements 105