Holiday Inn 2010 Annual Report Download - page 101
Download and view the complete annual report
Please find page 101 of the 2010 Holiday Inn annual report below. You can navigate through the pages in the report by either clicking on the pages listed below, or by using the keyword search tool below to find specific information within the annual report.-
 1
1 -
2
-
3
-
4
-
5
-
6
-
7
-
8
-
9
-
10
-
11
-
12
-
13
-
14
-
15
-
16
-
17
-
18
-
19
-
20
-
21
-
22
-
23
-
24
-
25
-
26
-
27
-
28
-
29
-
30
-
31
-
32
-
33
-
34
-
35
-
36
-
37
-
38
-
39
-
40
-
41
-
42
-
43
-
44
-
45
-
46
-
47
-
48
-
49
-
50
-
51
-
52
-
53
-
54
-
55
-
56
-
57
-
58
-
59
-
60
-
61
-
62
-
63
-
64
-
65
-
66
-
67
-
68
-
69
-
70
-
71
-
72
-
73
-
74
-
75
-
76
-
77
-
78
-
79
-
80
-
81
-
82
-
83
-
84
-
85
-
86
-
87
-
88
-
89
-
90
-
 91
91 -
 92
92 -
 93
93 -
 94
94 -
 95
95 -
 96
96 -
 97
97 -
 98
98 -
 99
99 -
 100
100 -
 101
101 -
 102
102 -
 103
103 -
 104
104 -
 105
105 -
 106
106 -
 107
107 -
 108
108 -
 109
109 -
 110
110 -
 111
111 -
112
-
113
-
114
-
115
-
116
-
117
-
118
-
119
-
120
-
121
-
122
-
123
-
124
 |
 |

OVERVIEW BUSINESS REVIEW
THE BOARD,
SENIOR MANAGEMENT AND
THEIR RESPONSIBILITIES
GROUP FINANCIAL
STATEMENTS
PARENT COMPANY
FINANCIAL STATEMENTS USEFUL INFORMATION
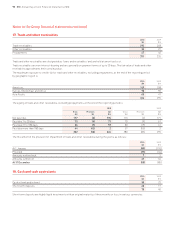
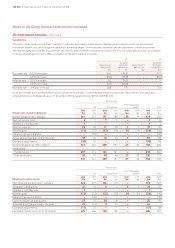
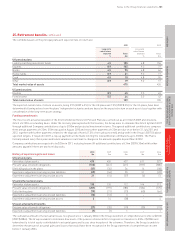
25. Retirement benefits continued
The assets and liabilities of the schemes and the amounts recognised in the Group statement of financial position are:
Pension plans
Post-employment
UK US and other benefits Total
2010 2009 2010 2009 2010 2009 2010 2009
$m $m $m $m $m $m $m $m
Retirement benefit assets
Fair value of plan assets – 426 16 16 – – 16 442
Present value of benefit obligations – (414) (11) (12) – – (11) (426)
Surplus in schemes – 12 5 4 – – 5 16
Asset restriction* – (4) – – – – – (4)
Total retirement benefit assets – 8 5 4 – – 5 12
Retirement benefit obligations
Fair value of plan assets 475 – 114 110 – – 589 110
Present value of benefit obligations (512) (47) (198) (185) (27) (20) (737) (252)
Deficit in schemes (37) (47) (84) (75) (27) (20) (148) (142)
Asset restriction and liability in respect
of funding commitments* (52) – – – – – (52) –
Total retirement benefit obligations (89) (47) (84) (75) (27) (20) (200) (142)
Total fair value of plan assets 475 426 130 126 – – 605 552
Total present value of benefit obligations (512) (461) (209) (197) (27) (20) (748) (678)
* Relates to tax that would be deducted at source in respect of a refund of the surplus taking into account amounts payable under funding commitments.
The ‘US and other’ surplus of $5m (2009 $4m) relates to a defined benefit pension scheme in Hong Kong. Included within the ‘US and other’
deficit is $2m (2009 $1m) relating to a defined benefit pension plan in the Netherlands.
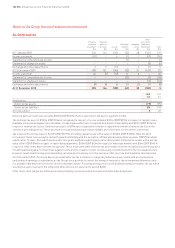
Assumptions
The principal financial assumptions used by the actuaries to determine the benefit obligation are:
Pension plans
Post-employment
UK US benefits
2010 2009 2010 2009 2010 2009
% % % % % %
Wages and salaries increases 5.0 5.1 – – 4.0 4.0
Pensions increases 3.5 3.6 – – – –
Discount rate 5.3 5.7 5.2 5.7 5.2 5.7
Inflation rate 3.5 3.6 – – – –
Healthcare cost trend rate assumed for next year – 9.0
– Pre 65 (ultimate rate reached in 2021) 10.0 –
– Post 65 (ultimate rate reached in 2023) 14.0 –
Ultimate rate that the cost trend rate trends to 5.0 5.0
Mortality is the most significant demographic assumption. The current assumptions for the UK plans are based on the S1NA tables with
long cohort projections and a 1% per annum underpin to future mortality improvements with age rated down by 1.75 years for pensioners
and 1.5 years for non-pensioners. In the US, the current assumptions are based on the RP-2000 IRS PPA @ 2011 Non-Annuitant/Annuitant
healthy tables for males and females.
In both territories, the assumptions have been revised during the year to reflect increased life expectancy at retirement age as follows:
Pension plans
UK US
2010 2009 2010 2009
Years Years Years Years
Current pensioners at 65a – male 24 23 19 18
– female 27 26 21 21
Future pensioners at 65b – male 26 24 21 18
– female 29 27 22 21
a Relates to assumptions based on longevity (in years) following retirement at the end of the reporting period.
b Relates to assumptions based on longevity (in years) relating to an employee retiring in 2030.
The assumptions allow for expected increases in longevity.
Notes to the Group financial statements 99