Hasbro 2012 Annual Report Download - page 95
Download and view the complete annual report
Please find page 95 of the 2012 Hasbro annual report below. You can navigate through the pages in the report by either clicking on the pages listed below, or by using the keyword search tool below to find specific information within the annual report.-
 1
1 -
2
-
3
-
4
-
5
-
6
-
7
-
8
-
9
-
10
-
11
-
12
-
13
-
14
-
15
-
16
-
17
-
18
-
19
-
20
-
21
-
22
-
23
-
24
-
25
-
26
-
27
-
28
-
29
-
30
-
31
-
32
-
33
-
34
-
35
-
36
-
37
-
38
-
39
-
40
-
41
-
42
-
43
-
44
-
45
-
46
-
47
-
48
-
49
-
50
-
51
-
52
-
53
-
54
-
55
-
56
-
57
-
58
-
59
-
60
-
61
-
62
-
63
-
64
-
65
-
66
-
67
-
68
-
69
-
70
-
71
-
72
-
73
-
74
-
75
-
76
-
77
-
78
-
79
-
80
-
81
-
82
-
83
-
84
-
 85
85 -
 86
86 -
 87
87 -
 88
88 -
 89
89 -
 90
90 -
 91
91 -
 92
92 -
 93
93 -
 94
94 -
 95
95 -
 96
96 -
 97
97 -
 98
98 -
 99
99 -
 100
100 -
 101
101 -
 102
102 -
 103
103 -
 104
104 -
 105
105 -
106
-
107
-
108
-
109
-
110
-
111
-
112
 |
 |

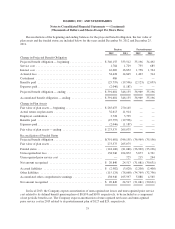
HASBRO, INC. AND SUBSIDIARIES
Notes to Consolidated Financial Statements — (Continued)
(Thousands of Dollars and Shares Except Per Share Data)
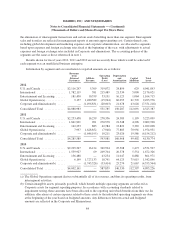
The following table represents consolidated International segment net revenues by major geographic region
for the three fiscal years ended December 30, 2012.
2012 2011 2010
Europe ........................................... $1,154,310 1,254,427 1,057,937
Latin America ..................................... 362,689 334,887 281,835
Asia Pacific ....................................... 265,120 272,587 220,155
Net revenues ...................................... $1,782,119 1,861,901 1,559,927
The following table presents consolidated net revenues by classes of principal products for the three fiscal
years ended December 30, 2012. Certain amounts in 2011 and 2010 have been reclassified to conform to the
2012 presentation.
2012 2011 2010
Boys ............................................. $1,577,010 1,821,544 1,345,523
Games ........................................... 1,192,090 1,169,672 1,293,772
Girls ............................................. 792,292 741,394 830,383
Preschool ......................................... 527,591 552,979 532,483
Net revenues ...................................... $4,088,983 4,285,589 4,002,161
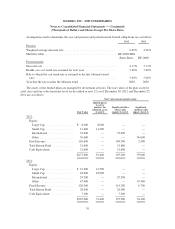
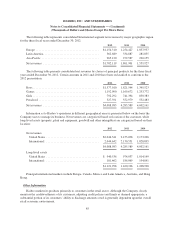
Information as to Hasbro’s operations in different geographical areas is presented below on the basis the
Company uses to manage its business. Net revenues are categorized based on location of the customer, while
long-lived assets (property, plant and equipment, goodwill and other intangibles) are categorized based on their
location:
2012 2011 2010
Net revenues
United States .................................... $2,044,341 2,155,038 2,173,266
International .................................... 2,044,642 2,130,551 1,828,895
$4,088,983 4,285,589 4,002,161
Long-lived assets
United States .................................... $ 940,536 974,037 1,014,149
International .................................... 181,462 186,069 194,841
$1,121,998 1,160,106 1,208,990
Principal international markets include Europe, Canada, Mexico and Latin America, Australia, and Hong
Kong.
Other Information
Hasbro markets its products primarily to customers in the retail sector. Although the Company closely
monitors the creditworthiness of its customers, adjusting credit policies and limits as deemed appropriate, a
substantial portion of its customers’ ability to discharge amounts owed is generally dependent upon the overall
retail economic environment.
85