Hasbro 2012 Annual Report Download - page 44
Download and view the complete annual report
Please find page 44 of the 2012 Hasbro annual report below. You can navigate through the pages in the report by either clicking on the pages listed below, or by using the keyword search tool below to find specific information within the annual report.-
 1
1 -
2
-
3
-
4
-
5
-
6
-
7
-
8
-
9
-
10
-
11
-
12
-
13
-
14
-
15
-
16
-
17
-
18
-
19
-
20
-
21
-
22
-
23
-
24
-
25
-
26
-
27
-
28
-
29
-
30
-
31
-
32
-
33
-
 34
34 -
 35
35 -
 36
36 -
 37
37 -
 38
38 -
 39
39 -
 40
40 -
 41
41 -
 42
42 -
 43
43 -
 44
44 -
 45
45 -
 46
46 -
 47
47 -
 48
48 -
 49
49 -
 50
50 -
 51
51 -
 52
52 -
 53
53 -
 54
54 -
55
-
56
-
57
-
58
-
59
-
60
-
61
-
62
-
63
-
64
-
65
-
66
-
67
-
68
-
69
-
70
-
71
-
72
-
73
-
74
-
75
-
76
-
77
-
78
-
79
-
80
-
81
-
82
-
83
-
84
-
85
-
86
-
87
-
88
-
89
-
90
-
91
-
92
-
93
-
94
-
95
-
96
-
97
-
98
-
99
-
100
-
101
-
102
-
103
-
104
-
105
-
106
-
107
-
108
-
109
-
110
-
111
-
112
 |
 |

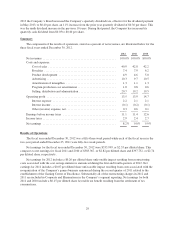
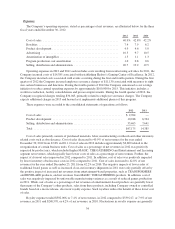
Expenses
The Company’s operating expenses, stated as percentages of net revenues, are illustrated below for the three
fiscal years ended December 30, 2012:
2012 2011 2010
Cost of sales ................................................... 40.9% 42.8% 42.2%
Royalties ...................................................... 7.4 7.9 6.2
Product development ............................................. 4.9 4.6 5.0
Advertising .................................................... 10.3 9.7 10.5
Amortization of intangibles ........................................ 1.3 1.1 1.3
Program production cost amortization ............................... 1.0 0.8 0.6
Selling, distribution and administration .............................. 20.7 19.2 19.5
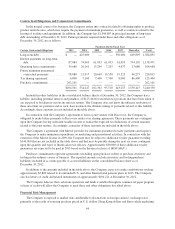
Operating expenses in 2012 and 2011 each includes costs resulting from restructuring activities. In 2011, the
Company incurred costs of $14,385 associated with establishing Hasbro’s Gaming Center of Excellence. In 2012,
the Company incurred costs associated with events occurring during the first and fourth quarters. During the first
quarter of 2012 the Company incurred employee severance charges of $11,130 associated with measures to right
size certain businesses and functions. During the fourth quarter of 2012 the Company announced a cost savings
initiative to reduce annual operating expenses by approximately $100,000 by 2015. This initiative includes a
workforce reduction, facility consolidations and process improvements. During the fourth quarter of 2012, the
Company recognized charges totaling $36,045, primarily related to employee severance charges. The Company
expects additional charges in 2013 and beyond as it implements additional phases of this program.
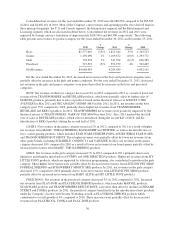
These expenses were recorded to the consolidated statements of operations as follows:
2012 2011
Cost of sales ...................................................... $ 2,764 —
Product development ............................................... 10,948 6,744
Selling, distribution and administration ................................. 33,463 7,641
Total ............................................................ $47,175 14,385
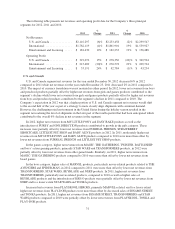
Cost of sales primarily consists of purchased materials, labor, manufacturing overheads and other inventory-
related costs such as obsolescence. Cost of sales decreased to 40.9% of net revenues for the year ended
December 30, 2012 from 42.8% in 2011. Cost of sales in 2012 includes approximately $2,800 related to the
reorganization of certain business units. Cost of sales as a percentage of net revenues in 2012 was positively
impacted by product mix, which included higher MAGIC: THE GATHERING and Entertainment and Licensing
segment net revenues, which typically have lower costs of sales as a percentage of net revenues. Further, the
impact of closeout sales improved in 2012 compared to 2011. In addition, cost of sales was positively impacted
by lower inventory obsolescence costs in 2012 compared to 2011. Cost of sales increased to 42.8% of net
revenues for the year ended December 25, 2011 from 42.2% in 2010. The negative impacts of lower sales of
traditional board games as well as increased close-out inventory shipments in 2011 were only partially offset by
the positive impact of increased net revenues from entertainment-based properties, such as TRANSFORMERS
and BEYBLADE products, and net revenues from MAGIC: THE GATHERING products. In addition, cost of
sales was negatively impacted by unfavorable manufacturing variances as a result of reduced games production
in 2011. While cost of sales as a percentage of net revenues of entertainment-based products are generally lower
than many of the Company’s other products, sales from these products, including Company owned or controlled
brands based on a movie release, also incur royalty expense. Such royalties reduce the benefit of these lower cost
of sales.
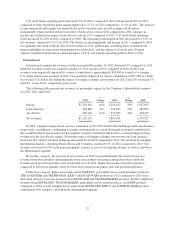
Royalty expense totaled $302,066, or 7.4% of net revenues, in 2012 compared to $339,217, or 7.9% of net
revenues, in 2011 and $248,570, or 6.2% of net revenues, in 2010. Fluctuations in royalty expense are generally
34