Hasbro 2012 Annual Report Download - page 61
Download and view the complete annual report
Please find page 61 of the 2012 Hasbro annual report below. You can navigate through the pages in the report by either clicking on the pages listed below, or by using the keyword search tool below to find specific information within the annual report.-
 1
1 -
2
-
3
-
4
-
5
-
6
-
7
-
8
-
9
-
10
-
11
-
12
-
13
-
14
-
15
-
16
-
17
-
18
-
19
-
20
-
21
-
22
-
23
-
24
-
25
-
26
-
27
-
28
-
29
-
30
-
31
-
32
-
33
-
34
-
35
-
36
-
37
-
38
-
39
-
40
-
41
-
42
-
43
-
44
-
45
-
46
-
47
-
48
-
49
-
50
-
 51
51 -
 52
52 -
 53
53 -
 54
54 -
 55
55 -
 56
56 -
 57
57 -
 58
58 -
 59
59 -
 60
60 -
 61
61 -
 62
62 -
 63
63 -
 64
64 -
 65
65 -
 66
66 -
 67
67 -
 68
68 -
 69
69 -
 70
70 -
 71
71 -
72
-
73
-
74
-
75
-
76
-
77
-
78
-
79
-
80
-
81
-
82
-
83
-
84
-
85
-
86
-
87
-
88
-
89
-
90
-
91
-
92
-
93
-
94
-
95
-
96
-
97
-
98
-
99
-
100
-
101
-
102
-
103
-
104
-
105
-
106
-
107
-
108
-
109
-
110
-
111
-
112
 |
 |

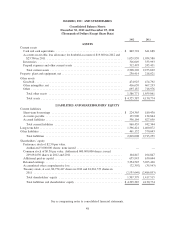
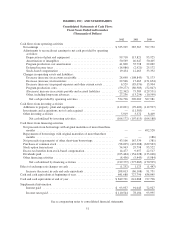
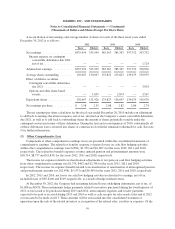
HASBRO, INC. AND SUBSIDIARIES
Consolidated Statements of Cash Flows
Fiscal Years Ended in December
(Thousands of Dollars)
2012 2011 2010
Cash flows from operating activities
Net earnings .................................................. $335,999 385,367 397,752
Adjustments to reconcile net earnings to net cash provided by operating
activities:
Depreciation of plant and equipment ............................. 99,718 113,821 95,925
Amortization of intangibles .................................... 50,569 46,647 50,405
Program production cost amortization ............................ 41,800 35,798 22,069
Deferred income taxes ........................................ (16,086) (2,921) 25,172
Stock-based compensation ..................................... 19,434 12,463 33,392
Changes in operating assets and liabilities:
Decrease (increase) in accounts receivable ........................ 28,690 (108,845) 71,173
Decrease (increase) in inventories ............................... 22,546 17,463 (151,634)
Decrease (increase) in prepaid expenses and other current assets ....... 6,529 (85,076) 15,904
Program production costs ...................................... (59,277) (80,983) (52,047)
(Decrease) increase in accounts payable and accrued liabilities ........ (22,362) 75,589 (129,531)
Other, including long-term advances ............................. 27,236 (13,254) (10,599)
Net cash provided by operating activities ....................... 534,796 396,069 367,981
Cash flows from investing activities
Additions to property, plant and equipment .......................... (112,091) (99,402) (112,597)
Investments and acquisitions, net of cash acquired .................... — (11,585) —
Other investing activities ........................................ 5,919 3,372 8,409
Net cash utilized by investing activities ......................... (106,172) (107,615) (104,188)
Cash flows from financing activities
Net proceeds from borrowings with original maturities of more than three
months .................................................... — — 492,528
Repayments of borrowings with original maturities of more than three
months .................................................... — — (186)
Net proceeds (repayments) of other short-term borrowings ............. 43,106 167,339 (381)
Purchases of common stock ...................................... (98,005) (423,008) (639,563)
Stock option transactions ........................................ 54,963 29,798 93,522
Excess tax benefits from stock-based compensation ................... 14,477 9,657 22,517
Dividends paid ................................................ (225,464) (154,028) (133,048)
Other financing activities ........................................ (8,456) (5,443) (5,984)
Net cash utilized by financing activities ........................ (219,379) (375,685) (170,595)
Effect of exchange rate changes on cash .............................. (1,232) 1,123 (1,447)
Increase (decrease) in cash and cash equivalents .................... 208,013 (86,108) 91,751
Cash and cash equivalents at beginning of year ......................... 641,688 727,796 636,045
Cash and cash equivalents at end of year .............................. $849,701 641,688 727,796
Supplemental information
Interest paid ................................................ $ 93,957 91,045 72,927
Income taxes paid ............................................ $110,544 78,104 93,995
See accompanying notes to consolidated financial statements.
51