Hasbro 2012 Annual Report Download - page 38
Download and view the complete annual report
Please find page 38 of the 2012 Hasbro annual report below. You can navigate through the pages in the report by either clicking on the pages listed below, or by using the keyword search tool below to find specific information within the annual report.-
 1
1 -
2
-
3
-
4
-
5
-
6
-
7
-
8
-
9
-
10
-
11
-
12
-
13
-
14
-
15
-
16
-
17
-
18
-
19
-
20
-
21
-
22
-
23
-
24
-
25
-
26
-
27
-
 28
28 -
 29
29 -
 30
30 -
 31
31 -
 32
32 -
 33
33 -
 34
34 -
 35
35 -
 36
36 -
 37
37 -
 38
38 -
 39
39 -
 40
40 -
 41
41 -
 42
42 -
 43
43 -
 44
44 -
 45
45 -
 46
46 -
 47
47 -
 48
48 -
49
-
50
-
51
-
52
-
53
-
54
-
55
-
56
-
57
-
58
-
59
-
60
-
61
-
62
-
63
-
64
-
65
-
66
-
67
-
68
-
69
-
70
-
71
-
72
-
73
-
74
-
75
-
76
-
77
-
78
-
79
-
80
-
81
-
82
-
83
-
84
-
85
-
86
-
87
-
88
-
89
-
90
-
91
-
92
-
93
-
94
-
95
-
96
-
97
-
98
-
99
-
100
-
101
-
102
-
103
-
104
-
105
-
106
-
107
-
108
-
109
-
110
-
111
-
112
 |
 |
other lifestyle products companies for the global marketing and distribution of licensed products based on the
Company’s brands. These relationships further broaden and amplify the consumer’s ability to experience the
Company’s brands.
As the Company seeks to grow its business in entertainment, licensing and digital gaming, the Company
will continue to evaluate strategic alliances and acquisitions which may complement its current product
offerings, allow it entry into an area which is adjacent to or complementary to the toy and game business, or
allow it to further develop awareness of its brands and expand the ability of consumers to experience its brands in
different forms and formats.
During 2011, the Company established Hasbro’s Gaming Center of Excellence in Rhode Island to centralize
games marketing and development while building on Hasbro’s strategy of re-imagining, re-inventing and re-
igniting core brands as well as inventing new brands.
During the first quarter of 2012 the Company took certain measures to strengthen its organization and right
size certain businesses and functions, resulting in employee termination and recognition of severance costs of
approximately $11,100.
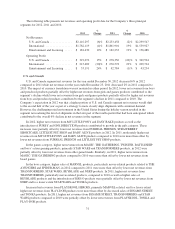
During the fourth quarter of 2012 the Company announced a plan in which it expects to generate annual cost
savings of $100,000 by 2015. This plan includes an approximate 10% workforce reduction, facility
consolidations and process improvements which reduce redundancy and increase efficiencies. Other cost savings
initiatives include focus on fewer, larger global brands and a reduction in the number of SKUs. During the fourth
quarter of 2012, the Company incurred expenses of approximately $36,100 related to this plan. The Company
expects to incur additional charges through 2013 as additional components of the plan are implemented.
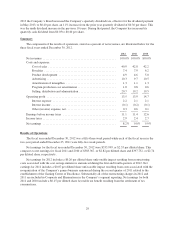
The Company’s business is highly seasonal with a significant amount of revenues occurring in the second
half of the year. In 2012, 2011 and 2010, the second half of the year accounted for 64%, 63% and 65% of the
Company’s net revenues, respectively.
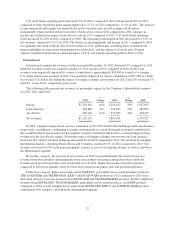
The Company sells its products both within the United States and in a number of international markets. In
recent years, the Company’s international net revenues have experienced growth as the Company has sought to
increase its international presence. One of the ways the Company has driven international growth is by opening
offices in certain markets to develop a greater presence. Since 2006, the Company has opened up operations in
new markets around the world including China, Brazil, Russia, Korea, Czech Republic, Peru and Colombia.
These represent emerging markets where the Company believes that it can achieve higher revenue growth than it
could achieve in more mature markets. Net revenues in emerging markets increased by 16% in 2012 compared to
2011 and represented more than 10% of consolidated net revenues in 2012. Net revenues of the Company’s
International segment represented 44%, 43% and 39% of total net revenues in 2012, 2011 and 2010, respectively.
The Company’s business is separated into three principal business segments, U.S. and Canada, International
and Entertainment and Licensing. The U.S. and Canada segment develops, markets and sells both toy and game
products in the United States and Canada. The International segment consists of the Company’s European, Asia
Pacific and Latin and South American toy and game marketing and sales operations. The Company’s
Entertainment and Licensing segment includes the Company’s lifestyle licensing, digital gaming, movie,
television and online entertainment operations. In addition to these three primary segments, the Company’s
world-wide manufacturing and product sourcing operations are managed through its Global Operations segment.
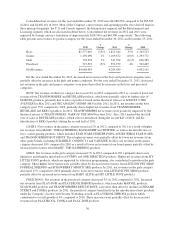
The Company is committed to returning excess cash to its shareholders through share repurchases and
dividends. As part of this initiative, from 2005 through 2011, the Company’s Board of Directors (the “Board”)
adopted six successive share repurchase authorizations with a cumulative authorized repurchase amount of
$2,825,000. The sixth authorization was approved in May 2011 for $500,000. At December 30, 2012, the
Company had $127,282 remaining available under this authorization. During the three years ended 2012, the
Company spent a total of $1,159,730, to repurchase 28,918 shares in the open market. The Company intends to,
at its discretion, opportunistically repurchase shares in the future subject to market conditions, the Company’s
other potential uses of cash and the Company’s levels of cash generation. In addition to the share repurchase
program, the Company also seeks to return excess cash through the payment of quarterly dividends. In February
28