Hasbro 2012 Annual Report Download - page 62
Download and view the complete annual report
Please find page 62 of the 2012 Hasbro annual report below. You can navigate through the pages in the report by either clicking on the pages listed below, or by using the keyword search tool below to find specific information within the annual report.-
 1
1 -
2
-
3
-
4
-
5
-
6
-
7
-
8
-
9
-
10
-
11
-
12
-
13
-
14
-
15
-
16
-
17
-
18
-
19
-
20
-
21
-
22
-
23
-
24
-
25
-
26
-
27
-
28
-
29
-
30
-
31
-
32
-
33
-
34
-
35
-
36
-
37
-
38
-
39
-
40
-
41
-
42
-
43
-
44
-
45
-
46
-
47
-
48
-
49
-
50
-
51
-
 52
52 -
 53
53 -
 54
54 -
 55
55 -
 56
56 -
 57
57 -
 58
58 -
 59
59 -
 60
60 -
 61
61 -
 62
62 -
 63
63 -
 64
64 -
 65
65 -
 66
66 -
 67
67 -
 68
68 -
 69
69 -
 70
70 -
 71
71 -
 72
72 -
73
-
74
-
75
-
76
-
77
-
78
-
79
-
80
-
81
-
82
-
83
-
84
-
85
-
86
-
87
-
88
-
89
-
90
-
91
-
92
-
93
-
94
-
95
-
96
-
97
-
98
-
99
-
100
-
101
-
102
-
103
-
104
-
105
-
106
-
107
-
108
-
109
-
110
-
111
-
112
 |
 |

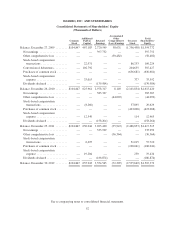
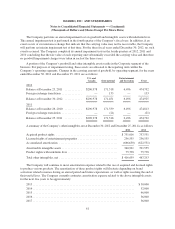
HASBRO, INC. AND SUBSIDIARIES
Consolidated Statements of Shareholders’ Equity
(Thousands of Dollars)
Common
Stock
Additional
Paid-in
Capital
Retained
Earnings
Accumulated
Other
Comprehensive
(Loss) Earnings
Treasury
Stock
Total
Shareholders’
Equity
Balance, December 27, 2009 ........ $104,847 467,183 2,720,549 58,631 (1,756,438) $1,594,772
Net earnings ................... — — 397,752 — — 397,752
Other comprehensive loss ........ — — — (50,482) — (50,482)
Stock-based compensation
transactions .................. — 22,971 — — 86,253 109,224
Conversion of debentures ......... — 102,792 — — 204,635 307,427
Purchases of common stock ....... — — — — (636,681) (636,681)
Stock-based compensation
expense ..................... — 33,015 — — 377 33,392
Dividends declared .............. — — (139,984) — — (139,984)
Balance, December 26, 2010 ........ $104,847 625,961 2,978,317 8,149 (2,101,854) $1,615,420
Net earnings ................... — — 385,367 — — 385,367
Other comprehensive loss ........ — — — (44,092) — (44,092)
Stock-based compensation
transactions .................. — (8,266) — — 37,895 29,629
Purchases of common stock ....... — — — — (423,008) (423,008)
Stock-based compensation
expense ..................... — 12,349 — — 114 12,463
Dividends declared .............. — — (158,264) — — (158,264)
Balance, December 25, 2011 ........ $104,847 630,044 3,205,420 (35,943) (2,486,853) $1,417,515
Net earnings ................... — — 335,999 — — 335,999
Other comprehensive loss ........ — — — (36,364) — (36,364)
Stock-based compensation
transactions .................. — 6,695 — — 51,015 57,710
Purchases of common stock ....... — — — — (100,041) (100,041)
Stock-based compensation
expense ..................... — 19,204 — — 230 19,434
Dividends declared .............. — — (186,874) — — (186,874)
Balance, December 30, 2012 ........ $104,847 655,943 3,354,545 (72,307) (2,535,649) $1,507,379
See accompanying notes to consolidated financial statements.
52