Hasbro 2012 Annual Report Download - page 79
Download and view the complete annual report
Please find page 79 of the 2012 Hasbro annual report below. You can navigate through the pages in the report by either clicking on the pages listed below, or by using the keyword search tool below to find specific information within the annual report.-
 1
1 -
2
-
3
-
4
-
5
-
6
-
7
-
8
-
9
-
10
-
11
-
12
-
13
-
14
-
15
-
16
-
17
-
18
-
19
-
20
-
21
-
22
-
23
-
24
-
25
-
26
-
27
-
28
-
29
-
30
-
31
-
32
-
33
-
34
-
35
-
36
-
37
-
38
-
39
-
40
-
41
-
42
-
43
-
44
-
45
-
46
-
47
-
48
-
49
-
50
-
51
-
52
-
53
-
54
-
55
-
56
-
57
-
58
-
59
-
60
-
61
-
62
-
63
-
64
-
65
-
66
-
67
-
68
-
 69
69 -
 70
70 -
 71
71 -
 72
72 -
 73
73 -
 74
74 -
 75
75 -
 76
76 -
 77
77 -
 78
78 -
 79
79 -
 80
80 -
 81
81 -
 82
82 -
 83
83 -
 84
84 -
 85
85 -
 86
86 -
 87
87 -
 88
88 -
 89
89 -
90
-
91
-
92
-
93
-
94
-
95
-
96
-
97
-
98
-
99
-
100
-
101
-
102
-
103
-
104
-
105
-
106
-
107
-
108
-
109
-
110
-
111
-
112
 |
 |

HASBRO, INC. AND SUBSIDIARIES
Notes to Consolidated Financial Statements — (Continued)
(Thousands of Dollars and Shares Except Per Share Data)
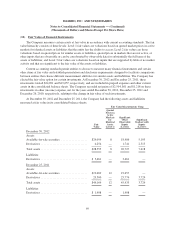
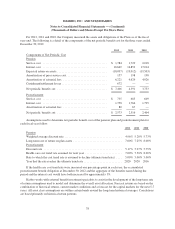
(12) Fair Value of Financial Instruments
The Company measures certain assets at fair value in accordance with current accounting standards. The fair
value hierarchy consists of three levels: Level 1 fair values are valuations based on quoted market prices in active
markets for identical assets or liabilities that the entity has the ability to access; Level 2 fair values are those
valuations based on quoted prices for similar assets or liabilities, quoted prices in markets that are not active, or
other inputs that are observable or can be corroborated by observable data for substantially the full term of the
assets or liabilities; and Level 3 fair values are valuations based on inputs that are supported by little or no market
activity and that are significant to the fair value of the assets or liabilities.
Current accounting standards permit entities to choose to measure many financial instruments and certain
other items at fair value and establish presentation and disclosure requirements designed to facilitate comparisons
between entities that choose different measurement attributes for similar assets and liabilities. The Company has
elected the fair value option for certain investments. At December 30, 2012 and December 25, 2011, these
investments totaled $24,091 and $19,657, respectively, and are included in prepaid expenses and other current
assets in the consolidated balance sheets. The Company recorded net gains of $2,504, $61 and $1,218 on these
investments in other (income) expense, net for the years ended December 30, 2012, December 25, 2011 and
December 26, 2010, respectively, relating to the change in fair value of such investments.
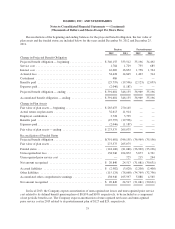
At December 30, 2012 and December 25, 2011, the Company had the following assets and liabilities
measured at fair value in its consolidated balance sheets:
Fair Value Measurements Using
Fair
Value
Quoted
Prices in
Active
Markets
for
Identical
Assets
(Level 1)
Significant
Other
Observable
Inputs
(Level 2)
Significant
Unobservable
Inputs
(Level 3)
December 30, 2012
Assets:
Available-for-sale securities .................. $24,099 8 18,986 5,105
Derivatives ................................ 4,254 — 1,741 2,513
Total assets ................................ $28,353 8 20,727 7,618
Liabilities:
Derivatives ................................ $ 3,461 — 3,461 —
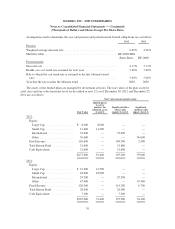
December 25, 2011
Assets:
Available-for-sale securities .................. $19,669 12 19,657 —
Derivatives ................................ 29,500 — 25,776 3,724
Total assets ................................ $49,169 12 45,433 3,724
Liabilities:
Derivatives ................................ $ 1,908 — 1,908 —
69