Hasbro 2012 Annual Report Download - page 45
Download and view the complete annual report
Please find page 45 of the 2012 Hasbro annual report below. You can navigate through the pages in the report by either clicking on the pages listed below, or by using the keyword search tool below to find specific information within the annual report.-
 1
1 -
2
-
3
-
4
-
5
-
6
-
7
-
8
-
9
-
10
-
11
-
12
-
13
-
14
-
15
-
16
-
17
-
18
-
19
-
20
-
21
-
22
-
23
-
24
-
25
-
26
-
27
-
28
-
29
-
30
-
31
-
32
-
33
-
34
-
 35
35 -
 36
36 -
 37
37 -
 38
38 -
 39
39 -
 40
40 -
 41
41 -
 42
42 -
 43
43 -
 44
44 -
 45
45 -
 46
46 -
 47
47 -
 48
48 -
 49
49 -
 50
50 -
 51
51 -
 52
52 -
 53
53 -
 54
54 -
 55
55 -
56
-
57
-
58
-
59
-
60
-
61
-
62
-
63
-
64
-
65
-
66
-
67
-
68
-
69
-
70
-
71
-
72
-
73
-
74
-
75
-
76
-
77
-
78
-
79
-
80
-
81
-
82
-
83
-
84
-
85
-
86
-
87
-
88
-
89
-
90
-
91
-
92
-
93
-
94
-
95
-
96
-
97
-
98
-
99
-
100
-
101
-
102
-
103
-
104
-
105
-
106
-
107
-
108
-
109
-
110
-
111
-
112
 |
 |

related to the volume of entertainment-driven products sold in a given year, especially if there is a major motion
picture release. Higher royalty expense in 2011 compared to 2012 and 2010 primarily reflects the higher sales of
certain entertainment-driven products in 2011, primarily BEYBLADE and TRANSFORMERS products,
compared to 2012 and 2010. In 2012, sales of MARVEL products, particularly those related to MARVEL’S THE
AVENGERS and THE AMAZING SPIDER-MAN, partially offset the reduction in sales of BEYBLADE and
movie-related TRANSFORMERS products from the prior year.
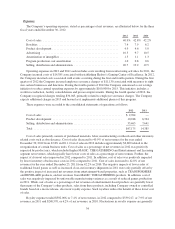
Product development expense in 2012 totaled $201,197, or 4.9% of net revenues, compared to $197,638, or
4.6% of net revenues, in 2011 and $201,358, or 5.0% of net revenues, in 2010. Product development expense for
2012 and 2011 includes restructuring charges of approximately $11,000 and $6,700, respectively. Excluding the
impact of these charges, product development expense remained flat in 2012 compared to 2011 and the lower
expense for each year compared to 2010 reflects the Company’s continued focus on leveraging its development
efforts on larger, global brands.
Advertising expense in 2012 increased to $422,239, or 10.3% of net revenues, compared to $413,951, or
9.7% of net revenues, in 2011 and $420,651, or 10.5% of net revenues, in 2010. Increased advertising in 2012
compared to 2011 in both dollars and as a percentage of net revenue is, in part, due to the Company’s strategy to
increase its spend in consumer-facing marketing and advertising. Lower advertising expense in 2011 compared to
2012 and 2010 reflects the increased volume in sales of entertainment-based properties, primarily
TRANSFORMERS and BEYBLADE products in 2011, which do not require the same level of advertising that
the Company spends on non-entertainment based products.
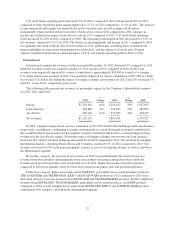
Amortization of intangibles increased to $50,569, or 1.3% of net revenues, compared to $46,647, or 1.1% of
net revenues, in 2011 and $50,405, or 1.3% of net revenues, in 2010. Increased amortization in 2012 compared to
2011 was the result of higher expense related to certain intangibles that are amortized based on actual and projected
net revenues. The decrease in 2011 is the result of certain properties becoming fully amortized during 2010.
Program production cost amortization increased to $41,800, or 1.0% of net revenues, compared to $35,798,
or 0.8% of net revenues, in 2011 and $22,069, or 0.6% of net revenues, in 2010. Program production costs are
capitalized as incurred and amortized using the individual-film-forecast method. The Company did not begin
amortizing program production costs until the third quarter of 2010, upon the initial distribution of its television
programming. The increase in 2012 reflects a higher number of television programs being produced and
distributed as well as higher net revenues. The increase in 2011 compared to 2010 primarily reflects four quarters
of activity whereas the comparable period of 2010 includes only two quarters of activity.
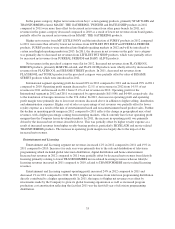
Selling, distribution and administration expenses increased to $847,347, or 20.7% of net revenues,
compared to $822,094, or 19.2% of net revenues, in 2011 and $781,192, or 19.5% of net revenues, in 2010.
Selling, distribution and administration expense for 2012 and 2011 includes approximately $33,500 and $7,600,
respectively, of restructuring charges. Excluding these charges, selling, distribution and administration expense
decreased in 2012 compared to 2011 as a result of lower shipping and warehousing costs related to lower
revenues and lower inventory balances. Increased stock compensation and bonus provisions in 2012 compared to
2011 were substantially offset by the favorable impact of currency translation. In 2011, increased shipping costs
related to higher revenues as well as increased expenses from the Company’s investments in emerging markets,
on-line operations, licensing, entertainment and its internal systems contributed to higher selling, distribution and
administration costs compared to 2010. These increases were partially offset by lower stock compensation and
bonus provisions in 2011 due to the Company’s underperformance in relation to its financial targets.
Interest Expense
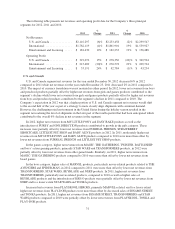
Interest expense increased to $91,141 in 2012 from $89,022 in 2011 and $82,112 in 2010. Increased interest
expense in 2012 compared to 2011 primarily reflects higher average short-term borrowings as well as the impact
of the extra week of interest expense on long-term debt in the first quarter of 2012 compared to 2011. The
increase in 2011 compared to 2010 is primarily due to the issuance of long-term debt during 2010. In March
2010, the Company issued $500,000 of long-term debt which bears interest at a rate of 6.35%. The impact on
interest expense of this issuance was partially offset by the conversion and redemption of the contingent
convertible debentures during March and April 2010, which bore interest at a rate of 2.75%.
35