Hasbro 2012 Annual Report Download - page 42
Download and view the complete annual report
Please find page 42 of the 2012 Hasbro annual report below. You can navigate through the pages in the report by either clicking on the pages listed below, or by using the keyword search tool below to find specific information within the annual report.-
 1
1 -
2
-
3
-
4
-
5
-
6
-
7
-
8
-
9
-
10
-
11
-
12
-
13
-
14
-
15
-
16
-
17
-
18
-
19
-
20
-
21
-
22
-
23
-
24
-
25
-
26
-
27
-
28
-
29
-
30
-
31
-
 32
32 -
 33
33 -
 34
34 -
 35
35 -
 36
36 -
 37
37 -
 38
38 -
 39
39 -
 40
40 -
 41
41 -
 42
42 -
 43
43 -
 44
44 -
 45
45 -
 46
46 -
 47
47 -
 48
48 -
 49
49 -
 50
50 -
 51
51 -
 52
52 -
53
-
54
-
55
-
56
-
57
-
58
-
59
-
60
-
61
-
62
-
63
-
64
-
65
-
66
-
67
-
68
-
69
-
70
-
71
-
72
-
73
-
74
-
75
-
76
-
77
-
78
-
79
-
80
-
81
-
82
-
83
-
84
-
85
-
86
-
87
-
88
-
89
-
90
-
91
-
92
-
93
-
94
-
95
-
96
-
97
-
98
-
99
-
100
-
101
-
102
-
103
-
104
-
105
-
106
-
107
-
108
-
109
-
110
-
111
-
112
 |
 |

U.S. and Canada operating profit increased 15% in 2012 compared to 2011 and decreased 20% in 2011
compared to 2010. Operating profit margin improved to 15.1% in 2012 compared to 12.4% in 2011. The increase
in operating profit and margin was primarily the result of product mix as well as improved inventory
management, which resulted in lower inventory obsolescence costs in 2012 compared to 2011. Changes in
product mix included less impact from closeout sales in 2012 compared to 2011. U.S. and Canada operating
profit decreased by 20% in 2011 compared to 2010. The operating profit margin in 2011 decreased to 12.4% of
net revenues compared to 15.2% in 2010. The decline in operating profit and margin in 2011 compared to 2010
was primarily the result of the decline in net revenues in 2011; product mix, including lower revenues from
games and higher revenues from entertainment-based products; and the impact of closeout sales. Foreign
currency translation did not have a material impact on U.S. and Canada operating profit in 2012 or 2011.
International
International segment net revenues for the year ended December 30, 2012 decreased 4% compared to 2011
while net revenues for the year ended December 25, 2011 increased 19% compared to 2010. In 2012, net
revenues were negatively impacted by currency translation of approximately $98,000 as a result of a stronger
U.S. dollar whereas net revenues in 2011 were positively impacted by currency translation of $59,300 as a result
of a weaker U.S. dollar. Excluding the impact of foreign exchange, net revenues for 2012 and 2011 increased 1%
and 16%, respectively, compared to prior years.
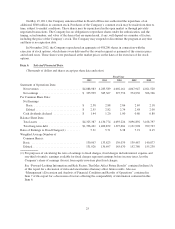
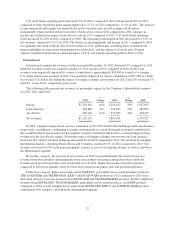
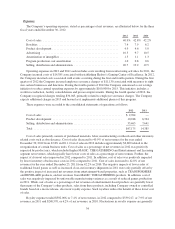
The following table presents net revenues by geographic region for the Company’s International segment
for 2012, 2011 and 2010.
2012
%
Change 2011
%
Change 2010
Europe .......................... $1,154,310 (8)% 1,254,427 19% 1,057,937
Latin America ..................... 362,689 8% 334,887 19% 281,835
Asia Pacific ...................... 265,120 (3)% 272,587 24% 220,155
Net revenues ...................... $1,782,119 1,861,901 1,559,927
In 2012, a negative impact from currency translation of $79,100 and $20,000 for Europe and Latin America,
respectively, in addition to challenging economic environments in certain developed economies contributed to
the overall decline in net revenues for the segment. Currency translation did not have a material impact on net
revenues for the Asia Pacific region. Absent the impact of foreign exchange, net revenues in Latin America
increased 14% and net revenues in Europe decreased 2% in 2012 compared to 2011. Net revenues in emerging
international markets, including Brazil, Russia and Colombia, increased 16% in 2012 compared to 2011. Net
revenues increased in 2011 in all major geographic regions as part of our ongoing strategy to achieve growth in
the International segment.
By product category, the decrease in net revenues in 2012 was predominantly the result of lower net
revenues from boys products and marginally lower net revenues from games and girls products while net
revenues from preschool products were flat for the year. In 2011, higher net revenues from boys products
compared to 2010 were partially offset by lower net revenues from games, girls and preschool products.
In the boys category, higher net revenues from MARVEL, particularly movie-related products related to
THE AVENGERS and SPIDER-MAN, KRE-O and STAR WARS products in 2012 compared to 2011 were
more than offset by lower net revenues from BEYBLADE and TRANSFORMERS products. In 2011, higher net
revenues from BEYBLADE, TRANSFORMERS, particularly movie-related products, and NERF products
compared to 2010 as well as higher net revenues from BEYBLADE, KRE-O and SUPER SOAKER products
contributed to the category’s growth in the International segment.
32