Hasbro 2012 Annual Report Download - page 59
Download and view the complete annual report
Please find page 59 of the 2012 Hasbro annual report below. You can navigate through the pages in the report by either clicking on the pages listed below, or by using the keyword search tool below to find specific information within the annual report.-
 1
1 -
2
-
3
-
4
-
5
-
6
-
7
-
8
-
9
-
10
-
11
-
12
-
13
-
14
-
15
-
16
-
17
-
18
-
19
-
20
-
21
-
22
-
23
-
24
-
25
-
26
-
27
-
28
-
29
-
30
-
31
-
32
-
33
-
34
-
35
-
36
-
37
-
38
-
39
-
40
-
41
-
42
-
43
-
44
-
45
-
46
-
47
-
48
-
 49
49 -
 50
50 -
 51
51 -
 52
52 -
 53
53 -
 54
54 -
 55
55 -
 56
56 -
 57
57 -
 58
58 -
 59
59 -
 60
60 -
 61
61 -
 62
62 -
 63
63 -
 64
64 -
 65
65 -
 66
66 -
 67
67 -
 68
68 -
 69
69 -
70
-
71
-
72
-
73
-
74
-
75
-
76
-
77
-
78
-
79
-
80
-
81
-
82
-
83
-
84
-
85
-
86
-
87
-
88
-
89
-
90
-
91
-
92
-
93
-
94
-
95
-
96
-
97
-
98
-
99
-
100
-
101
-
102
-
103
-
104
-
105
-
106
-
107
-
108
-
109
-
110
-
111
-
112
 |
 |

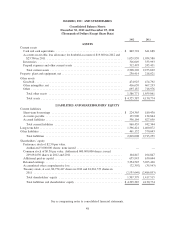
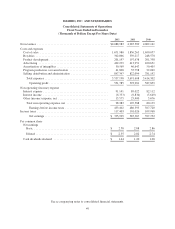
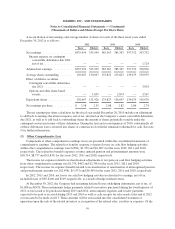
HASBRO, INC. AND SUBSIDIARIES
Consolidated Statements of Operations
Fiscal Years Ended in December
(Thousands of Dollars Except Per Share Data)
2012 2011 2010
Net revenues ................................................ $4,088,983 4,285,589 4,002,161
Costs and expenses
Cost of sales .............................................. 1,671,980 1,836,263 1,690,057
Royalties ................................................. 302,066 339,217 248,570
Product development ........................................ 201,197 197,638 201,358
Advertising ............................................... 422,239 413,951 420,651
Amortization of intangibles ................................... 50,569 46,647 50,405
Program production cost amortization .......................... 41,800 35,798 22,069
Selling, distribution and administration ......................... 847,347 822,094 781,192
Total expenses ........................................... 3,537,198 3,691,608 3,414,302
Operating profit ........................................ 551,785 593,981 587,859
Non-operating (income) expense
Interest expense ............................................ 91,141 89,022 82,112
Interest income ............................................ (6,333) (6,834) (5,649)
Other (income) expense, net .................................. 13,575 25,400 3,676
Total non-operating expense, net ............................ 98,383 107,588 80,139
Earnings before income taxes ............................. 453,402 486,393 507,720
Income taxes ................................................ 117,403 101,026 109,968
Net earnings ........................................... $ 335,999 385,367 397,752
Per common share
Net earnings
Basic .................................................. $ 2.58 2.88 2.86
Diluted ................................................. $ 2.55 2.82 2.74
Cash dividends declared ..................................... $ 1.44 1.20 1.00
See accompanying notes to consolidated financial statements.
49