Hasbro 2012 Annual Report Download - page 41
Download and view the complete annual report
Please find page 41 of the 2012 Hasbro annual report below. You can navigate through the pages in the report by either clicking on the pages listed below, or by using the keyword search tool below to find specific information within the annual report.-
 1
1 -
2
-
3
-
4
-
5
-
6
-
7
-
8
-
9
-
10
-
11
-
12
-
13
-
14
-
15
-
16
-
17
-
18
-
19
-
20
-
21
-
22
-
23
-
24
-
25
-
26
-
27
-
28
-
29
-
30
-
 31
31 -
 32
32 -
 33
33 -
 34
34 -
 35
35 -
 36
36 -
 37
37 -
 38
38 -
 39
39 -
 40
40 -
 41
41 -
 42
42 -
 43
43 -
 44
44 -
 45
45 -
 46
46 -
 47
47 -
 48
48 -
 49
49 -
 50
50 -
 51
51 -
52
-
53
-
54
-
55
-
56
-
57
-
58
-
59
-
60
-
61
-
62
-
63
-
64
-
65
-
66
-
67
-
68
-
69
-
70
-
71
-
72
-
73
-
74
-
75
-
76
-
77
-
78
-
79
-
80
-
81
-
82
-
83
-
84
-
85
-
86
-
87
-
88
-
89
-
90
-
91
-
92
-
93
-
94
-
95
-
96
-
97
-
98
-
99
-
100
-
101
-
102
-
103
-
104
-
105
-
106
-
107
-
108
-
109
-
110
-
111
-
112
 |
 |

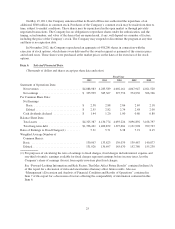
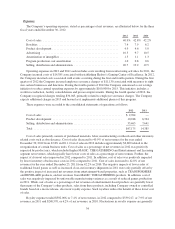
The following table presents net revenues and operating profit data for the Company’s three principal
segments for 2012, 2011 and 2010.
2012
%
Change 2011
%
Change 2010
Net Revenues
U.S. and Canada ............... $2,116,297 (6)% $2,253,458 (2)% $2,299,547
International .................. $1,782,119 (4)% $1,861,901 19% $1,559,927
Entertainment and Licensing ..... $ 181,430 12% $ 162,233 19% $ 136,488
Operating Profit
U.S. and Canada ............... $ 319,072 15% $ 278,356 (20)% $ 349,594
International .................. $ 215,489 (20)% $ 270,578 29% $ 209,704
Entertainment and Licensing ..... $ 53,191 24% $ 42,784 (1)% $ 43,234
U.S. and Canada
U.S. and Canada segment net revenues for the year ended December 30, 2012 decreased 6% in 2012
compared to 2011 while net revenues for the year ended December 25, 2011 decreased 2% in 2011 compared to
2010. The impact of currency translation was not material in either period. In 2012, lower net revenues from boys
and preschool products partially offset by higher net revenues from girls and games products contributed to the
segment’s decline while lower net revenues from girls and games products partially offset by higher net revenues
from boys and preschool products contributed to the segment’s decline in 2011 compared to 2010. The
Company’s expectation in 2012 was that a higher portion of U.S. and Canada segment net revenues would shift
to the second half of the year as part of a strategy to more closely align shipments with consumer demand.
However, the challenging retail environment in the United States during the holiday season resulted in the
segment not realizing the level of shipments in the later part of the fourth quarter that had been anticipated which
contributed to the overall 6% decline in net revenues in the segment.
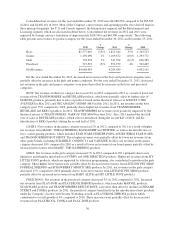
In 2012, higher net revenues from MY LITTLE PONY and EASY BAKE products as well as the
introduction of FURBY and ONE DIRECTION products contributed to growth in the girls category. These
increases were partially offset by lower net revenues from FURREAL FRIENDS, STRAWBERRY
SHORTCAKE, LITTLEST PET SHOP and BABY ALIVE products in 2012. In 2011, moderately higher net
revenues from MY LITTLE PONY and BABY ALIVE products compared to 2010 were more than offset by
lower net revenues from FURREAL FRIENDS and LITTLEST PET SHOP products.
In the games category, higher net revenues from MAGIC: THE GATHERING, TWISTER, BATTLESHIP
and boys’ action gaming products, primarily STAR WARS and TRANSFORMERS products, in 2012 were
partially offset by lower net revenues from other game brands. Similarly, in 2011, higher net revenues from
MAGIC: THE GATHERING products compared to 2010 were more than offset by lower net revenues from
board games.
In the boys category, higher sales of MARVEL products, particularly movie-related products related to THE
AVENGERS and SPIDER-MAN, in 2012 compared to 2011 were more than offset by lower net revenues from
TRANSFORMERS, STAR WARS, BEYBLADE and NERF products. In 2011, higher net revenues from
TRANSFORMERS, particularly movie-related products, compared to 2010 as well as higher sales of
BEYBLADE products and the introduction of KRE-O products were partially offset by lower net revenues from
NERF and to a lesser extent STAR WARS and TONKA products.
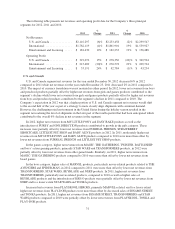
Increased net revenues from PLAYSKOOL HEROES, primarily MARVEL-related, and to a lesser extent
higher net revenues from PLAY-DOH products were more than offset by decreased sales of SESAME STREET
and TONKA products. In 2011, higher net revenues from SESAME STREET, TRANSFORMERS and STAR
WARS products compared to 2010 were partially offset by lower net revenues from PLAYSKOOL, TONKA and
PLAY-DOH products.
31