GE 2007 Annual Report Download - page 92
Download and view the complete annual report
Please find page 92 of the 2007 GE annual report below. You can navigate through the pages in the report by either clicking on the pages listed below, or by using the keyword search tool below to find specific information within the annual report.-
 1
1 -
2
-
3
-
4
-
5
-
6
-
7
-
8
-
9
-
10
-
11
-
12
-
13
-
14
-
15
-
16
-
17
-
18
-
19
-
20
-
21
-
22
-
23
-
24
-
25
-
26
-
27
-
28
-
29
-
30
-
31
-
32
-
33
-
34
-
35
-
36
-
37
-
38
-
39
-
40
-
41
-
42
-
43
-
44
-
45
-
46
-
47
-
48
-
49
-
50
-
51
-
52
-
53
-
54
-
55
-
56
-
57
-
58
-
59
-
60
-
61
-
62
-
63
-
64
-
65
-
66
-
67
-
68
-
69
-
70
-
71
-
72
-
73
-
74
-
75
-
76
-
77
-
78
-
79
-
80
-
81
-
 82
82 -
 83
83 -
 84
84 -
 85
85 -
 86
86 -
 87
87 -
 88
88 -
 89
89 -
 90
90 -
 91
91 -
 92
92 -
 93
93 -
 94
94 -
 95
95 -
 96
96 -
 97
97 -
 98
98 -
 99
99 -
 100
100 -
 101
101 -
 102
102 -
103
-
104
-
105
-
106
-
107
-
108
-
109
-
110
-
111
-
112
-
113
-
114
-
115
-
116
-
117
-
118
-
119
-
120
 |
 |

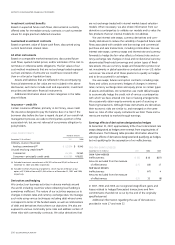
90 ge 2007 annual report
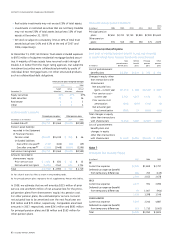
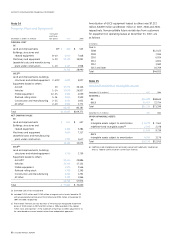
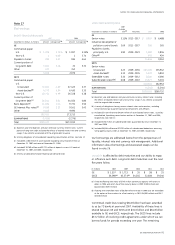
During 2007, we recorded additions to intangible assets subject
to amortization of $4,286 million. The components of fi nite-lived
intangible assets acquired during 2007 and their respective
weighted-average useful lives are: $2,277 million — Customer-related
(17.5 years); $299 million — Patents, licenses and trademarks
(20.2 years); $590 million — Capitalized software (4.2 years);
$992 million — Lease valuations (7.6 years); and $128 million —
All other (9.9 years).
Consolidated amortization related to intangible assets subject
to amortization was $2,080 million and $1,744 million for 2007 and
2006, respectively. We estimate that annual pre-tax amortization
for intangible assets subject to amortization over the next fi ve
calendar years to be as follows: 2008 — $1,969 million; 2009 —
$1,804 million; 2010 — $1,635 million; 2011 — $1,470 million;
2012 — $1,320 million.
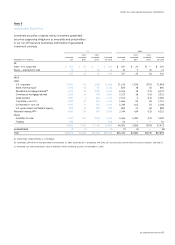
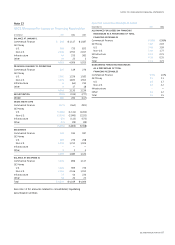
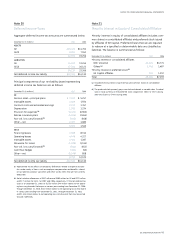
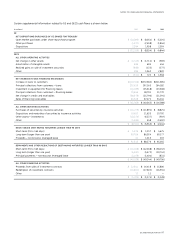
Note 16
All Other Assets
December 31 (In millions) 2007 2006
GE
Investments
Associated companies $ 1,871 $ 1,543
Other
(a)
1,243 733
3,114 2,276
Pension asset — principal plans 20,190 15,019
Contract costs and estimated earnings 5,983 5,164
Film and television costs 4,143 3,646
Long-term receivables, including notes 2,331 2,892
Derivative instruments
279 193
Other 4,568 4,252
40,608 33,442
GECS
Investments
Real estate (b) 40,488 27,252
Associated companies 17,026 12,053
Assets held for sale
(c) 10,690 7,738
Cost method
(d) 2,742 2,348
Other 1,020 931
71,966 50,322
Derivative instruments 3,271 1,981
Advances to suppliers 2,046 1,714
Deferred acquisition costs 1,282 1,380
Other 4,840 3,990
83,405 59,387
ELIMINATIONS (1,152) (1,178)
Tot al $122,861 $91,651
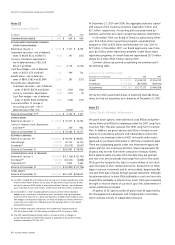
(a) The fair value of and unrealized loss on cost method investments in a continuous
loss position at December 31, 2007 and 2006, were insignifi cant.
(b) GECS investment in real estate consisted principally of two categories: real estate
held for investment and equity method investments. Both categories contained
a wide range of properties including the following at December 31, 2007: offi ce
buildings (49%), apartment buildings (14%), industrial properties (11%), retail
facilities (9%), franchise properties (7%), parking facilities (2%) and other (8%).
At December 31, 2007, investments were located in the Americas (48%), Europe
(33%) and Asia (19%).
(c) Assets were classifi ed as held for sale on the date a decision was made to dispose
of them through sale, securitization or other means. Such assets consisted primarily
of real estate properties and credit card receivables, and were accounted for at the
lower of carrying amount or estimated fair value less costs to sell. These amounts
are net of valuation allowances of $153 million and $3 million at December 31,
2007 and 2006, respectively.
(d) The fair value of and unrealized loss on those investments in a continuous loss
position for less than 12 months at December 31, 2007, were $546 million and
$93 million, respectively, which included $282 million fair value and $15 million
unrealized losses related to our investment in FGIC Corporation (FGIC) preferred
stock and $36 million fair value and $29 million unrealized losses related to our
investment in FGIC common stock. The fair value of and unrealized loss on those
investments in a continuous loss position for 12 months or more at December 31,
2007, were $18 million and $8 million, respectively. The fair value of and unrealized
loss on those investments in a continuous loss position for less than 12 months
at December 31, 2006, were $113 million and $25 million, respectively. The fair
value of and unrealized loss on those investments in a continuous loss position for
12 months or more at December 31, 2006, were $38 million and $8 million,
respectively.