GE 2007 Annual Report Download - page 101
Download and view the complete annual report
Please find page 101 of the 2007 GE annual report below. You can navigate through the pages in the report by either clicking on the pages listed below, or by using the keyword search tool below to find specific information within the annual report.-
 1
1 -
2
-
3
-
4
-
5
-
6
-
7
-
8
-
9
-
10
-
11
-
12
-
13
-
14
-
15
-
16
-
17
-
18
-
19
-
20
-
21
-
22
-
23
-
24
-
25
-
26
-
27
-
28
-
29
-
30
-
31
-
32
-
33
-
34
-
35
-
36
-
37
-
38
-
39
-
40
-
41
-
42
-
43
-
44
-
45
-
46
-
47
-
48
-
49
-
50
-
51
-
52
-
53
-
54
-
55
-
56
-
57
-
58
-
59
-
60
-
61
-
62
-
63
-
64
-
65
-
66
-
67
-
68
-
69
-
70
-
71
-
72
-
73
-
74
-
75
-
76
-
77
-
78
-
79
-
80
-
81
-
82
-
83
-
84
-
85
-
86
-
87
-
88
-
89
-
90
-
 91
91 -
 92
92 -
 93
93 -
 94
94 -
 95
95 -
 96
96 -
 97
97 -
 98
98 -
 99
99 -
 100
100 -
 101
101 -
 102
102 -
 103
103 -
 104
104 -
 105
105 -
 106
106 -
 107
107 -
 108
108 -
 109
109 -
 110
110 -
 111
111 -
112
-
113
-
114
-
115
-
116
-
117
-
118
-
119
-
120
 |
 |

ge 2007 annual report 99
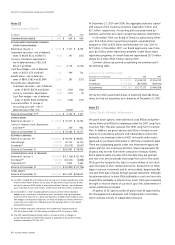
Assets and liabilities not carried at fair value in our Statement of
Financial Position are discussed below. Apart from certain of our
borrowings and certain marketable securities, few of the instru-
ments discussed below are actively traded and their fair values
must often be determined using fi nancial models. Realization of
the fair value of these instruments depends upon market forces
beyond our control, including marketplace liquidity. Therefore,
the disclosed fair values may not be indicative of net realizable
value or refl ect future fair values.
A description of how we estimate fair values follows.
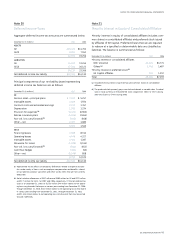
Loans
Based on quoted market prices, recent transactions and/or dis-
counted future cash fl ows, using rates at which similar loans
would have been made to similar borrowers.
Borrowings
Based on discounted future cash fl ows using current market
rates which are comparable to market quotes.
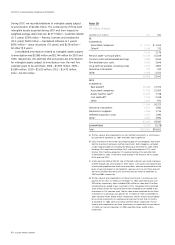
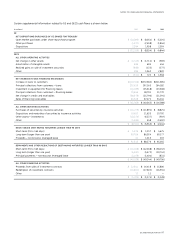
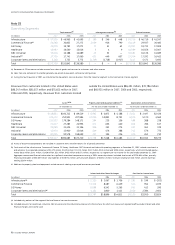
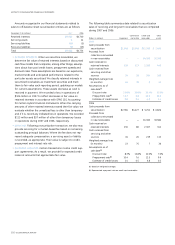
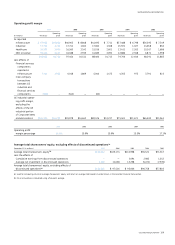
Note 26
Financial Instruments
2007 2006
Assets (liabilities) Assets (liabilities)
Notional Carrying Estimated Notional Carrying Estimated
December 31 (In millions) amount amount (net) fair value amount amount (net) fair value
GE
Assets
Investments and notes receivable
$(a) $ 538 $ 538 $
(a) $ 481 $ 481
Liabilities
Borrowings (b)
(a)
(15,762) (15,819) (a) (11,119) (11,026)
GECS
Assets
Loans
(a)
311,160 309,065 (a) 260,412 259,883
Other commercial and residential mortgages held for sale (a) 4,891 4,939 (a) 2,644 2,703
Loans held for sale (a) 3,808 3,809 (a) 3,498 3,498
Other fi nancial instruments
(c)
(a) 2,778 3,164 (a) 2,439 2,883
Liabilities
Borrowings
(b)(d)
(a)
(500,925) (503,610) (a) (426,266) (432,261)
Investment contract benefi ts
(a) (4,536) (4,914) (a) (5,089) (5,080)
Guaranteed investment contracts (a) (11,705) (11,630) (a) (11,870) (11,756)
Insurance — credit life (e) 1,500 (35) (24) 2,634 (81) (61)
(a) These fi nancial instruments do not have notional amounts.
(b) See note 17.
(c) Principally cost method investments.
(d) Included effects of interest rate and cross-currency derivatives.
(e) Net of reinsurance of $2,815 million and $840 million at December 31, 2007 and 2006, respectively.
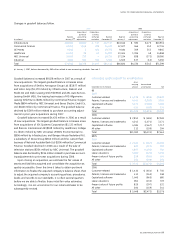
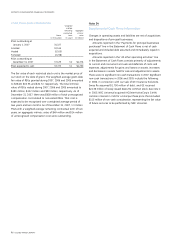
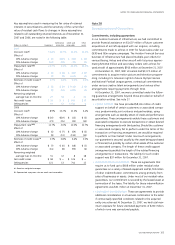
Property, plant and equipment — net associated with operations
based in the United States were $27,213 million, $25,699 million
and $24,262 million at year-end 2007, 2006 and 2005, respec-
tively. Property, plant and equipment — net associated with oper-
ations based outside the United States were $50,682 million,
$44,951 million and $38,106 million at year-end 2007, 2006 and
2005, respectively.
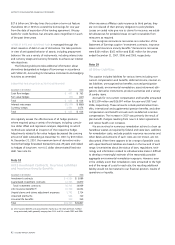
Basis for presentation
Our operating businesses are organized based on the nature of
markets and customers. Segment accounting policies are the
same as described in note 1. Segment results for our fi nancial
services businesses refl ect the discrete tax effect of transactions,
but the intraperiod tax allocation is refl ected outside of the seg-
ment unless otherwise noted in segment results.
Effects of transactions between related companies are
eliminated and consist primarily of GECS services for material
procurement and trade receivables management; buildings and
equipment (including automobiles) leased by GE from GECS; infor-
mation technology (IT) and other services sold to GECS by GE;
aircraft engines manufactured by GE that are installed on aircraft
purchased by GECS from third-party producers for lease to others;
medical equipment manufactured by GE that is leased by GECS
to others; and various investments, loans and allocations of GE
corporate overhead costs.
A description of our operating segments can be found on page
106 and details of segment profi t by operating segment can be
found in the Summary of Operating Segments table on page 47 of
this report.