GE 2007 Annual Report Download - page 110
Download and view the complete annual report
Please find page 110 of the 2007 GE annual report below. You can navigate through the pages in the report by either clicking on the pages listed below, or by using the keyword search tool below to find specific information within the annual report.-
 1
1 -
2
-
3
-
4
-
5
-
6
-
7
-
8
-
9
-
10
-
11
-
12
-
13
-
14
-
15
-
16
-
17
-
18
-
19
-
20
-
21
-
22
-
23
-
24
-
25
-
26
-
27
-
28
-
29
-
30
-
31
-
32
-
33
-
34
-
35
-
36
-
37
-
38
-
39
-
40
-
41
-
42
-
43
-
44
-
45
-
46
-
47
-
48
-
49
-
50
-
51
-
52
-
53
-
54
-
55
-
56
-
57
-
58
-
59
-
60
-
61
-
62
-
63
-
64
-
65
-
66
-
67
-
68
-
69
-
70
-
71
-
72
-
73
-
74
-
75
-
76
-
77
-
78
-
79
-
80
-
81
-
82
-
83
-
84
-
85
-
86
-
87
-
88
-
89
-
90
-
91
-
92
-
93
-
94
-
95
-
96
-
97
-
98
-
99
-
 100
100 -
 101
101 -
 102
102 -
 103
103 -
 104
104 -
 105
105 -
 106
106 -
 107
107 -
 108
108 -
 109
109 -
 110
110 -
 111
111 -
 112
112 -
 113
113 -
 114
114 -
 115
115 -
 116
116 -
 117
117 -
 118
118 -
 119
119 -
 120
120
 |
 |

108 ge 2007 annual report
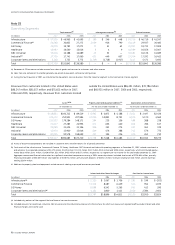
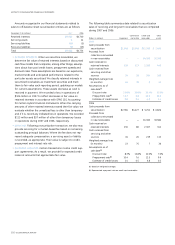
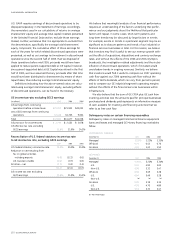
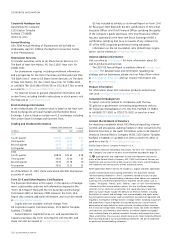
Organic revenue growth in 2004
(In millions) 2004 2003 % change
GE consolidated revenues
as reported $124,176 $104,624
Less the effects of
Acquisitions, business dispositions
(other than dispositions of busi-
nesses acquired for investment)
and currency exchange rates 19,219 1,262
Insurance 4,002 4,466
Energy 17,348 19,082
Investigation-related adjustments
Revenue recognition 160 (45)
GECS interest rate swaps 518 535
SFAS 133 503 454
Reclassifi cations of discontinued
operations (10,275) (8,752)
GE consolidated revenues excluding
the effects of acquisitions, business
dispositions (other than dispositions
of businesses acquired for invest-
ment), currency exchange rates,
Insurance, Energy, investigation-
related adjustments and reclassifi -
cations of discontinued operations
(organic revenues)
$ 92,701 $ 87,622 6%
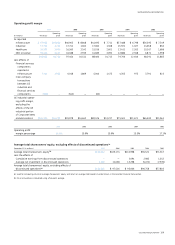
Free cash flow
(In millions) 2007 2006 2005 2004 2003
GE cash fl ow from operating activities — continuing
operations as reported $ 23,301 $ 23,772 $19,902 $13,765 $11,615
Adjusted for the effects of
Additions to property, plant and equipment (2,968) (2,913) (2,225) (1,818) (1,673)
Proceeds from sales of discontinued operations 10,826 1,987 — — —
Proceeds from principal business dispositions 1,047 1,497 267 707 85
Dividends paid to shareowners (11,492) (10,420) (9,352) (8,278) (7,643)
All other investing activities (1,697) 100 1,519 705 64
GE cash fl ow from operating activities — continuing operations
as reported less the effects of additions to property, plant and
equipment, proceeds from sales of discontinued operations,
proceeds from principal business dispositions, dividends paid to
shareowners, and all other investing activities (free cash fl ow) $ 19,017 $ 14,023 $10,111 $ 5,081 $ 2,448
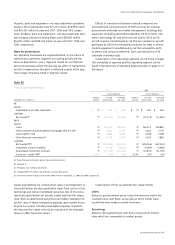
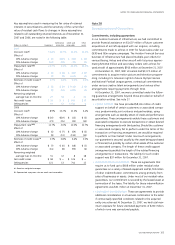
Organic revenue growth in 2003
(In millions) 2003 2002 % change
GE consolidated revenues
as reported $104,624 $103,071
Less the effects of
Acquisitions, business dispositions
(other than dispositions of busi-
nesses acquired for investment)
and currency exchange rates 6,516 1,953
Insurance 4,466 4,930
Energy 18,462 22,926
Investigation-related adjustments
Revenue recognition (45) (183)
GECS interest rate swaps 535 (1,889)
SFAS 133 454 16
Reclassifi cations of discontinued
operations (8,752) (8,713)
GE consolidated revenues excluding
the effects of acquisitions, business
dispositions (other than dispositions
of businesses acquired for invest-
ment), currency exchange rates,
Insurance, Energy, investigation-
related adjustments and reclassifi -
cations of discontinued operations
(organic revenues) $ 82,988 $ 84,031 (1)%
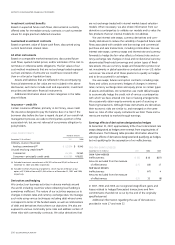
Growth in industrial CFOA in 2007
(In millions)
2007 2006 % change
Cash from GE’s operating activities
as reported $23,301 $23,772
Less dividends from GECS 7,291 9,847
Cash from GE’s operating activities
excluding dividends from GECS
(industrial CFOA)
$16,010 $13,925 15%