GE 2007 Annual Report Download - page 106
Download and view the complete annual report
Please find page 106 of the 2007 GE annual report below. You can navigate through the pages in the report by either clicking on the pages listed below, or by using the keyword search tool below to find specific information within the annual report.-
 1
1 -
2
-
3
-
4
-
5
-
6
-
7
-
8
-
9
-
10
-
11
-
12
-
13
-
14
-
15
-
16
-
17
-
18
-
19
-
20
-
21
-
22
-
23
-
24
-
25
-
26
-
27
-
28
-
29
-
30
-
31
-
32
-
33
-
34
-
35
-
36
-
37
-
38
-
39
-
40
-
41
-
42
-
43
-
44
-
45
-
46
-
47
-
48
-
49
-
50
-
51
-
52
-
53
-
54
-
55
-
56
-
57
-
58
-
59
-
60
-
61
-
62
-
63
-
64
-
65
-
66
-
67
-
68
-
69
-
70
-
71
-
72
-
73
-
74
-
75
-
76
-
77
-
78
-
79
-
80
-
81
-
82
-
83
-
84
-
85
-
86
-
87
-
88
-
89
-
90
-
91
-
92
-
93
-
94
-
95
-
 96
96 -
 97
97 -
 98
98 -
 99
99 -
 100
100 -
 101
101 -
 102
102 -
 103
103 -
 104
104 -
 105
105 -
 106
106 -
 107
107 -
 108
108 -
 109
109 -
 110
110 -
 111
111 -
 112
112 -
 113
113 -
 114
114 -
 115
115 -
 116
116 -
117
-
118
-
119
-
120
 |
 |

104 ge 2007 annual report
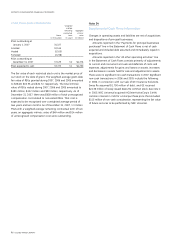
Our guarantees are provided in the ordinary course of business.
We underwrite these guarantees considering economic, liquidity
and credit risk of the counterparty. We believe that the likelihood
is remote that any such arrangements could have a signifi cant
adverse effect on our fi nancial position, results of operations or
liquidity. We record liabilities for guarantees at estimated fair value,
generally the amount of the premium received, or if we do not
receive a premium, the amount based on appraisal, observed
market values or discounted cash fl ows. Any associated expected
recoveries from third parties are recorded as other receivables;
not netted against the liabilities.
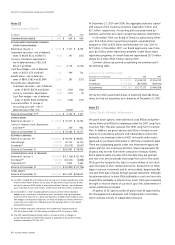
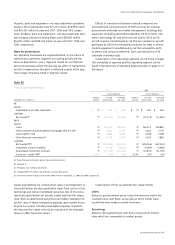
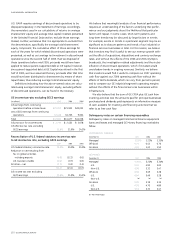
Product warranties
We provide for estimated product warranty expenses when we
sell the related products. Because warranty estimates are fore-
casts that are based on the best available information — mostly
historical claims experience — claims costs may differ from
amounts provided. An analysis of changes in the liability for
product warranties follows.
(In millions)
2007 2006 2005
Balance at January 1 $1,339 $1,240 $1,481
Current year provisions 637 885 525
Expenditures
(a) (573) (785) (766)
Other changes 138 (1) —
Balance at December 31
$1,541 $1,339 $1,240
(a) Primarily related to Infrastructure and Healthcare.
For GE, gross profi t from sales is sales of goods and services less
costs of goods and services sold.
Earnings-per-share amounts are computed independently each
quarter for earnings from continuing operations, earnings (loss)
from discontinued operations and net earnings. As a result, the
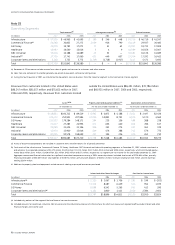
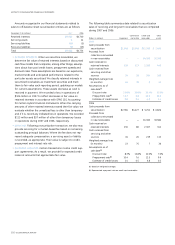
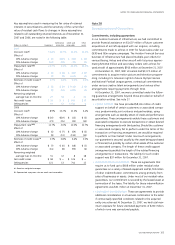
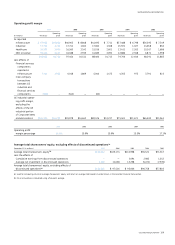
Note 29
Quarterly Information (Unaudited)
First quarter Second quarter Third quarter Fourth quarter
(In millions; per-share amounts in dollars) 2007 2006 2007 2006 2007 2006 2007 2006
CONSOLIDATED
Earnings from continuing operations $ 4,928 $ 4,006 $ 5,613 $ 4,685 $ 5,106 $ 4,744 $ 6,821 $ 5,945
Earnings (loss) from discontinued operations (357) 513 (231) 236 453 117 (125) 496
Net earnings
$ 4,571 $ 4,519 $ 5,382 $ 4,921 $ 5,559 $ 4,861 $ 6,696 $ 6,441
Per-share amounts — earnings from
continuing operations
Diluted earnings per share
$ 0.48 $ 0.38 $ 0.54 $ 0.45 $ 0.50 $ 0.46 $ 0.68 $ 0.58
Basic earnings per share 0.48 0.38 0.55 0.45 0.50 0.46 0.68 0.58
Per-share amounts — earnings (loss) from
discontinued operations
Diluted earnings per share (0.03) 0.05 (0.02) 0.02 0.04 0.01 (0.01) 0.05
Basic earnings per share (0.03) 0.05 (0.02) 0.02 0.04 0.01 (0.01) 0.05
Per-share amounts — net earnings
Diluted earnings per share 0.44 0.43 0.52 0.47 0.54 0.47 0.66 0.62
Basic earnings per share 0.44 0.43 0.52 0.47 0.55 0.47 0.67 0.63
SELECTED DATA
GE
Sales of goods and services $21,688 $21,143 $24,269 $22,041 $24,690 $22,180 $29,149 $24,555
Gross profi t from sales 5,660 5,394 6,537 6,192 6,357 5,836 7,757 7,133
GECS
Total revenues 17,485 14,394 17,235 14,937 18,120 15,586 19,346 16,709
Earnings from continuing operations 3,424 2,317 2,421 2,505 3,214 2,521 3,369 2,912
sum of each quarter’s per-share amount may not equal the total
per-share amount for the respective year; and the sum of per-share
amounts from continuing operations and discontinued operations
may not equal the total per-share amounts for net earnings for
the respective quarters.