Columbia Sportswear 2001 Annual Report Download - page 32
Download and view the complete annual report
Please find page 32 of the 2001 Columbia Sportswear annual report below. You can navigate through the pages in the report by either clicking on the pages listed below, or by using the keyword search tool below to find specific information within the annual report.-
 1
1 -
2
-
3
-
4
-
5
-
6
-
7
-
8
-
9
-
10
-
11
-
12
-
13
-
14
-
15
-
16
-
17
-
18
-
19
-
20
-
21
-
 22
22 -
 23
23 -
 24
24 -
 25
25 -
 26
26 -
 27
27 -
 28
28 -
 29
29 -
 30
30 -
 31
31 -
 32
32 -
 33
33 -
 34
34 -
 35
35 -
 36
36 -
 37
37 -
 38
38 -
 39
39 -
 40
40 -
 41
41 -
 42
42 -
43
-
44
-
45
-
46
-
47
-
48
-
49
-
50
-
51
-
52
 |
 |

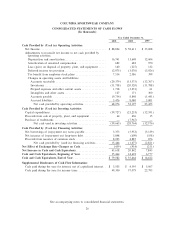
COLUMBIA SPORTSWEAR COMPANY
CONSOLIDATED STATEMENTS OF CASH FLOWS
(In thousands)
Year Ended December 31,
2001 2000 1999
Cash Provided by (Used in) Operating Activities:
Net Income ÏÏÏÏÏÏÏÏÏÏÏÏÏÏÏÏÏÏÏÏÏÏÏÏÏÏÏÏÏÏÏÏÏÏÏÏÏÏÏÏÏÏÏÏÏÏ $ 88,824 $ 58,611 $ 33,008
Adjustments to reconcile net income to net cash provided by
operating activities:
Depreciation and amortizationÏÏÏÏÏÏÏÏÏÏÏÏÏÏÏÏÏÏÏÏÏÏÏÏÏÏÏÏÏ 16,741 13,648 12,604
Amortization of unearned compensation ÏÏÏÏÏÏÏÏÏÏÏÏÏÏÏÏÏÏÏÏ 682 682 970
Loss (gain) on disposal of property, plant, and equipment ÏÏÏÏÏ 140 (227) 132
Deferred income tax provisionÏÏÏÏÏÏÏÏÏÏÏÏÏÏÏÏÏÏÏÏÏÏÏÏÏÏÏÏÏ (2,075) (3,076) (3,026)
Tax beneÑt from employee stock plans ÏÏÏÏÏÏÏÏÏÏÏÏÏÏÏÏÏÏÏÏÏ 7,514 2,586 399
Changes in operating assets and liabilities:
Accounts receivable ÏÏÏÏÏÏÏÏÏÏÏÏÏÏÏÏÏÏÏÏÏÏÏÏÏÏÏÏÏÏÏÏÏÏÏ (29,379) (13,375) (12,767)
Inventories ÏÏÏÏÏÏÏÏÏÏÏÏÏÏÏÏÏÏÏÏÏÏÏÏÏÏÏÏÏÏÏÏÏÏÏÏÏÏÏÏÏÏÏ (11,738) (20,520) (11,788)
Prepaid expenses and other current assets ÏÏÏÏÏÏÏÏÏÏÏÏÏÏÏÏÏ 1,718 (3,231) 61
Intangibles and other assets ÏÏÏÏÏÏÏÏÏÏÏÏÏÏÏÏÏÏÏÏÏÏÏÏÏÏÏÏÏ 127 171 300
Accounts payable ÏÏÏÏÏÏÏÏÏÏÏÏÏÏÏÏÏÏÏÏÏÏÏÏÏÏÏÏÏÏÏÏÏÏÏÏÏ (9,754) 8,848 (1,441)
Accrued liabilities ÏÏÏÏÏÏÏÏÏÏÏÏÏÏÏÏÏÏÏÏÏÏÏÏÏÏÏÏÏÏÏÏÏÏÏÏÏ 5,476 8,080 5,001
Net cash provided by operating activitiesÏÏÏÏÏÏÏÏÏÏÏÏÏÏÏÏ 68,276 52,197 23,453
Cash Provided by (Used in) Investing Activities:
Capital expenditures ÏÏÏÏÏÏÏÏÏÏÏÏÏÏÏÏÏÏÏÏÏÏÏÏÏÏÏÏÏÏÏÏÏÏÏÏÏÏÏ (39,727) (21,233) (12,591)
Proceeds from sale of property, plant, and equipment ÏÏÏÏÏÏÏÏÏÏÏ 64 436 15
Purchase of trademarks ÏÏÏÏÏÏÏÏÏÏÏÏÏÏÏÏÏÏÏÏÏÏÏÏÏÏÏÏÏÏÏÏÏÏÏÏ Ì (7,967) Ì
Net cash used in investing activitiesÏÏÏÏÏÏÏÏÏÏÏÏÏÏÏÏÏÏÏÏ (39,663) (28,764) (12,576)
Cash Provided by (Used in) Financing Activities:
Net borrowings of (repayment on) notes payableÏÏÏÏÏÏÏÏÏÏÏÏÏÏÏ 3,373 (5,953) (3,139)
Net issuance of (repayment on) long-term debtÏÏÏÏÏÏÏÏÏÏÏÏÏÏÏÏ 3,848 (609) (558)
Proceeds from issuance of common stock ÏÏÏÏÏÏÏÏÏÏÏÏÏÏÏÏÏÏÏÏÏ 8,223 4,885 876
Net cash provided by (used in) Ñnancing activities ÏÏÏÏÏÏÏ 15,444 (1,677) (2,821)
Net EÅect of Exchange Rate Changes on CashÏÏÏÏÏÏÏÏÏÏÏÏÏÏÏÏÏÏ (439) (914) (211)
Net Increase in Cash and Cash EquivalentsÏÏÏÏÏÏÏÏÏÏÏÏÏÏÏÏÏÏÏÏÏ 43,618 20,842 7,845
Cash and Cash Equivalents, Beginning of YearÏÏÏÏÏÏÏÏÏÏÏÏÏÏÏÏÏÏ 35,464 14,622 6,777
Cash and Cash Equivalents, End of Year ÏÏÏÏÏÏÏÏÏÏÏÏÏÏÏÏÏÏÏÏÏÏÏ $ 79,082 $ 35,464 $ 14,622
Supplemental Disclosures of Cash Flow Information:
Cash paid during the year for interest, net of capitalized interestÏÏ $ 3,503 $ 4,595 $ 5,067
Cash paid during the year for income taxes ÏÏÏÏÏÏÏÏÏÏÏÏÏÏÏÏÏÏÏ 49,300 37,079 22,795
See accompanying notes to consolidated Ñnancial statements.
26