Columbia Sportswear 2001 Annual Report Download - page 20
Download and view the complete annual report
Please find page 20 of the 2001 Columbia Sportswear annual report below. You can navigate through the pages in the report by either clicking on the pages listed below, or by using the keyword search tool below to find specific information within the annual report.-
 1
1 -
2
-
3
-
4
-
5
-
6
-
7
-
8
-
9
-
 10
10 -
 11
11 -
 12
12 -
 13
13 -
 14
14 -
 15
15 -
 16
16 -
 17
17 -
 18
18 -
 19
19 -
 20
20 -
 21
21 -
 22
22 -
 23
23 -
 24
24 -
 25
25 -
 26
26 -
 27
27 -
 28
28 -
 29
29 -
 30
30 -
31
-
32
-
33
-
34
-
35
-
36
-
37
-
38
-
39
-
40
-
41
-
42
-
43
-
44
-
45
-
46
-
47
-
48
-
49
-
50
-
51
-
52
 |
 |
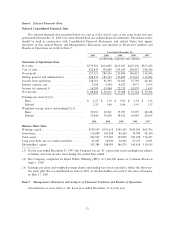
Income Tax Expense: The provision for income taxes was $56.8 million and $33.5 million for 2001 and
2000, respectively. The provision for income taxes as a percentage of pre-tax income was 39.0% and 36.4% for
2001 and 2000, respectively. The lower tax rate in 2000 was due primarily to the utilization of foreign tax
credits which were not replicated in 2001.
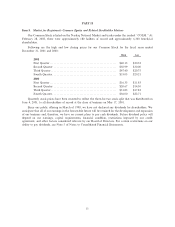
Year Ended December 31, 2000 Compared to Year Ended December 31, 1999
Net sales: Net sales increased 30.7% to $614.8 million in 2000 from $470.5 million in 1999. Domestic
sales increased 28.5% to $438.9 million in 2000 from $341.6 million in 1999. Canadian sales increased 25.2%
to $63.1 million in 2000 from $50.4 million in 1999 and European direct sales increased 42.5% to $59.0 million
in 2000 from $41.4 million in 1999. Net international sales, excluding Canadian sales and European direct
sales, increased 45.0% to $53.8 million in 2000 from $37.1 million in 1999. These increases were primarily
attributable to increased sales of outerwear units, predominantly in the United States, Canada and Europe,
and increased sales of sportswear and footwear units across all regions.
Gross ProÑt: Gross proÑt as a percentage of net sales was 45.6% and 44.8% for 2000 and 1999,
respectively. This increase of 80 basis points in gross margin was due to a combination of factors including
increased margin on sales of spring sportswear close-out products for the three months ended June 30, 2000
when compared to the three months ended June 30, 1999, and strong domestic and Canadian margins
resulting from minimal oÅ price selling during the six months ended December 31, 2000, partially oÅset by the
weakness in the Euro currency. These increases were oÅset by decreased sales of carry-over fall close-out
products during the three months ended March 31, 2000 when compared to the three months ended
March 31, 1999.
Selling, General and Administrative Expense: Selling, general, and administrative expense (SG&A)
increased 21.8% to $183.7 million in 2000 from $150.8 million in 1999, primarily as a result of an increase in
variable selling and operating expenses to support the higher level of sales. As a percentage of sales, SG&A
decreased to 29.9% for the year ended December 31, 2000 from 32.1% for the comparable period in 1999. This
change was primarily due to strong sales growth in 2000, coupled with minimal additional investment in
infrastructure. In addition, the third quarter 1999 results included a $1.5 million charge for the closing of our
ChaÅee, Missouri manufacturing plant.
Interest Expense: Interest expense decreased by 12.1% in 2000 from the comparable period in 1999. The
decrease was primarily attributable to our increased cash position during the Ñrst, second and fourth quarters
of 2000 as compared to the same periods in 1999 and our decreased borrowings during the third quarter of
2000 compared to third quarter of 1999.
Income Tax Expense: The provision for income taxes was $33.5 million and $22.2 million for 2000 and
1999, respectively. The provision for income taxes as a percentage of pre-tax income was 36.4% and 40.2% for
2000 and 1999, respectively. The decrease in tax rates was due primarily to the utilization of foreign tax
credits.
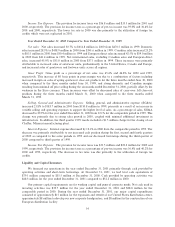
Liquidity and Capital Resources
We Ñnanced our operations in the year ended December 31, 2001 primarily through cash provided by
operating activities and short-term borrowings. At December 31, 2001, we had total cash equivalents of
$79.1 million compared to $35.5 million at December 31, 2000. Cash provided by operating activities was
$68.3 million for the year ended December 31, 2001 compared to $52.2 million in 2000.
Our primary capital requirements are for working capital and general corporate needs. Net cash used in
investing activities was $39.7 million for the year ended December 31, 2001 and $28.8 million for the
comparable period in 2000. During the year ended December 31, 2001, our major capital expenditures
consisted of approximately $15 million for the expansion and retroÑt of our United States distribution center,
approximately $8 million to develop our new corporate headquarters, and $8 million for the construction of our
European distribution facility.
14