Brother International 2014 Annual Report Download - page 63
Download and view the complete annual report
Please find page 63 of the 2014 Brother International annual report below. You can navigate through the pages in the report by either clicking on the pages listed below, or by using the keyword search tool below to find specific information within the annual report.-
 1
1 -
2
-
3
-
4
-
5
-
6
-
7
-
8
-
9
-
10
-
11
-
12
-
13
-
14
-
15
-
16
-
17
-
18
-
19
-
20
-
21
-
22
-
23
-
24
-
25
-
26
-
27
-
28
-
29
-
30
-
31
-
32
-
33
-
34
-
35
-
36
-
37
-
38
-
39
-
40
-
41
-
42
-
43
-
44
-
45
-
46
-
47
-
48
-
49
-
50
-
51
-
52
-
 53
53 -
 54
54 -
 55
55 -
 56
56 -
 57
57 -
 58
58 -
 59
59 -
 60
60 -
 61
61 -
 62
62 -
 63
63 -
 64
64 -
 65
65 -
 66
66 -
 67
67
 |
 |

62
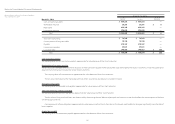
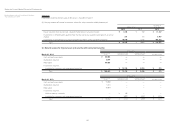
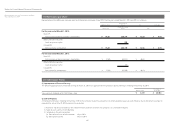
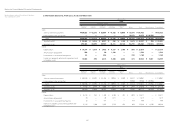
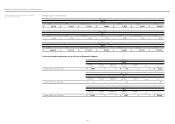
3. Information about Sales, Profit (Loss), Assets and Other Items
Millions of Yen
2014
Reportable segment
Printing &
Solutions
Personal
& Home
Machinery
& Solution
Network
& Contents
Industrial
Part Others Total
Reconciliations
Consolidated
Sales
Sales to external customers ¥430,826 ¥ 43,276 ¥ 63,098 ¥ 47,582 ¥ 16,099 ¥ 15,954 ¥616,835 — ¥616,835
Intersegment sales or transfers — — — — — 10,379 10,379 ¥ (10,379) —
Total ¥430,826 ¥ 43,276 ¥ 63,098 ¥ 47,582 ¥ 16,099 ¥ 26,333 ¥627,214 ¥ (10,379) ¥616,835
Segment profit ¥ 30,958 ¥ 4,216 ¥ 4,991 ¥ 452 ¥ 1,106 ¥ 1,674 ¥ 43,397 ¥ (96) ¥ 43,301
Segment assets 294,346 30,496 55,569 34,311 48,136 82,788 545,646 (75,673) 469,973
Other:
Depreciation ¥ 18,714 ¥ 1,018 ¥ 1,492 ¥ 4,317 ¥ 1,109 ¥ 964 ¥ 27,614 — ¥ 27,614
Amortization of goodwill 290 — 20 1,228 — — 1,538 — 1,538
Investments in associated companies 35 — 425 — — 720 1,180 — 1,180
Increase in property, plant and equipment and
intangible assets 18,592 895 2,215 5,404 2,252 474 29,832 ¥ 5,027 34,859
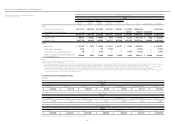
Millions of Yen
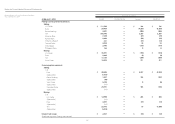
2013
Reportable segment
Printing &
Solutions
Personal
& Home
Machinery
& Solution
Network
& Contents
Industrial
Part Others Total
Reconciliations
Consolidated
Sales
Sales to external customers ¥ 350,836 ¥ 33,805 ¥ 61,416 ¥ 50,083 ¥ 3,680 ¥ 16,247 ¥ 516,067 — ¥ 516,067
Intersegment sales or transfers — — — — — 10,966 10,966 ¥ (10,966) —
Total ¥ 350,836 ¥ 33,805 ¥ 61,416 ¥ 50,083 ¥ 3,680 ¥ 27,213 ¥ 527,033 ¥ (10,966) ¥ 516,067
Segment profit ¥ 18,826 ¥ 2,488 ¥ 4,006 ¥ 2,314 ¥ 308 ¥ 1,944 ¥ 29,886 ¥ (110) ¥ 29,776
Segment assets 248,464 25,048 46,914 33,682 41,962 73,705 469,775 (48,280) 421,495
Other:
Depreciation ¥ 16,725 ¥ 982 ¥ 1,350 ¥ 4,106 ¥ 285 ¥ 1,029 ¥ 24,477 — ¥ 24,477
Amortization of goodwill 84 — 20 1,315 — — 1,419 — 1,419
Investments in associated companies 32 — 477 — — 479 988 — 988
Increase in property, plant and equipment and
intangible assets
15,132 1,106 2,822 5,770 424 694 25,948 ¥ 4,290 30,238
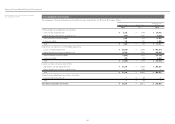
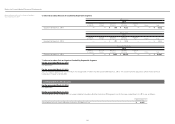
Brother Industries, Ltd. and Consolidated Subsidiaries
Year ended March 31, 2014
Notes to Consolidated Financial Statements