Brother International 2014 Annual Report Download - page 38
Download and view the complete annual report
Please find page 38 of the 2014 Brother International annual report below. You can navigate through the pages in the report by either clicking on the pages listed below, or by using the keyword search tool below to find specific information within the annual report.-
 1
1 -
2
-
3
-
4
-
5
-
6
-
7
-
8
-
9
-
10
-
11
-
12
-
13
-
14
-
15
-
16
-
17
-
18
-
19
-
20
-
21
-
22
-
23
-
24
-
25
-
26
-
27
-
 28
28 -
 29
29 -
 30
30 -
 31
31 -
 32
32 -
 33
33 -
 34
34 -
 35
35 -
 36
36 -
 37
37 -
 38
38 -
 39
39 -
 40
40 -
 41
41 -
 42
42 -
 43
43 -
 44
44 -
 45
45 -
 46
46 -
 47
47 -
 48
48 -
49
-
50
-
51
-
52
-
53
-
54
-
55
-
56
-
57
-
58
-
59
-
60
-
61
-
62
-
63
-
64
-
65
-
66
-
67
 |
 |
37
Brother Industries, Ltd. and Consolidated Subsidiaries
Year ended March 31, 2014 March 31, 2014
Thousands of U.S. Dollars
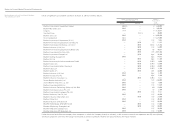
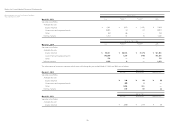
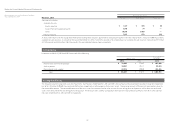
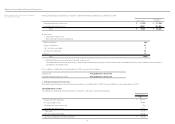
Proceeds Realized Gains Realized Losses
Securities classified as:
Available-for-sale:
Equity securities $ 1,417 $ 485 $ (0)
Government and corporate bonds 3,883 78 —
Other 10,641 3,408 —
Held-to-maturity 7,951 573 (29)
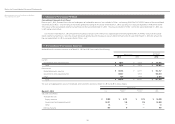
As discussed in Note 2 (8), the Group reclassified certain trading debt securities, “government and corporate bonds” with a fair value of ¥3,811 million ($37,000 thousand) to
available-for-sale securities. As a result, for the year ended March 31, 2014, investment securities and unrealized gain on available-for-sale securities increased by ¥59 million
($573 thousand) and ¥38 million ($369 thousand) in the consolidated balance sheet, respectively.
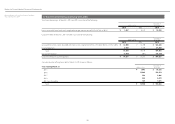
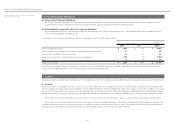
5. Inventories
Inventories at March 31, 2014 and 2013 consisted of the following:
Millions of Yen
Thousands of
U.S. Dollars
2014 2013 2014
Merchandise and finished products ¥ 70,205 ¥ 57,482 $ 681,602
Work in process 10,287 10,117 99,873
Raw materials and supplies 22,915 20,080 222,476
Total ¥ 103,407 ¥ 87,679 $ 1,003,951
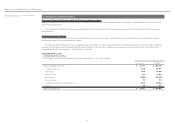
6. Long-lived Assets
The Group reviewed its long-lived assets for impairment. For the years ended March 31, 2014 and 2013, the Company and consolidated subsidiaries recorded impairment
loss of ¥2,122 million ($20,602 thousand) and ¥269 million, respectively, as other expense, for business assets. The carrying amounts of these assets were written down to
the recoverable amount. The recoverable amount of business assets was measured at the value in use or the net selling price at disposition, while idle assets and rental
assets were measured at the net selling price at disposition. The discount rates used for computation of the present value of future cash flows were 10.7% and 12.6% for
the years ended March 31, 2014 and 2013, respectively.
Notes to Consolidated Financial Statements