Brother International 2014 Annual Report Download - page 5
Download and view the complete annual report
Please find page 5 of the 2014 Brother International annual report below. You can navigate through the pages in the report by either clicking on the pages listed below, or by using the keyword search tool below to find specific information within the annual report.-
 1
1 -
 2
2 -
 3
3 -
 4
4 -
 5
5 -
 6
6 -
 7
7 -
 8
8 -
 9
9 -
 10
10 -
 11
11 -
 12
12 -
 13
13 -
 14
14 -
 15
15 -
 16
16 -
17
-
18
-
19
-
20
-
21
-
22
-
23
-
24
-
25
-
26
-
27
-
28
-
29
-
30
-
31
-
32
-
33
-
34
-
35
-
36
-
37
-
38
-
39
-
40
-
41
-
42
-
43
-
44
-
45
-
46
-
47
-
48
-
49
-
50
-
51
-
52
-
53
-
54
-
55
-
56
-
57
-
58
-
59
-
60
-
61
-
62
-
63
-
64
-
65
-
66
-
67
 |
 |

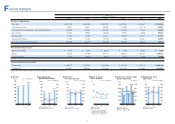
4
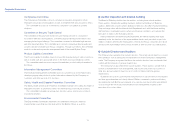
Millions of Yen
Fiscal years ended March 31
2009 2010 2011 2012 2013 2014
Results of Operations:
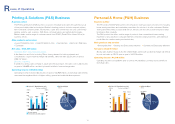
Net sales ¥ 482,205 ¥ 446,269 ¥ 502,830 ¥ 4 97, 39 0 ¥ 516,067 ¥ 616,835
Operating income 19,901 26,637 36,092 34,18 3 29,776 43,301
Income before income taxes and minority interests 23,613 26,234 34,062 34,10 8 27, 94 6 33,527
Net income 15,262 19,629 26,238 19,525 17, 8 26 19,221
Depreciation 23,094 21,028 24,027 23,069 24,477 27,614
Capital expenditures 2 7,16 9 17, 4 8 2 19,788 2 7, 8 3 3 30,237 34,859
Research and development costs 36,859 34,779 36,253 39,232 37, 514 40,137
Per Common Share (yen):
Basic net income ¥ 56.79 ¥ 73.34 ¥ 98.03 ¥ 72.95 ¥ 66.65 ¥ 72.20
Equity 735.26 792.95 822.43 863.01 985.85 1,097.01
Cash dividends 26.00*18.00 24.00 24.00 24.00 24.00
Financial Position at Year-End:
Total equity ¥ 199,371 ¥ 213,532 ¥ 220,469 ¥ 231,425 ¥ 278,771 ¥ 308,310
Total assets 3 37, 6 67 365,991 372,646 370,906 421,495 469,973
* Includes commemorative dividends of ¥2 per share to mark the 100th anniversary of the Company’s founding.
0
10
20
30
40
50
60
34.2
29.8
Operating Income
Operating Income Ratio
(¥ billion)
Fiscal years ended March 31
201420132012
5
10
15
20
25
30
0
(%)
6.95.87.0
43.3
Operating income (left)
Operating income ratio (right)
0
201420132012
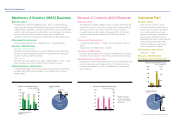
5.34.54.3
8.7
7.26.9
Fiscal years ended March 31
10
15
5
Return on Assets
Return on Equity
(%)
Return on Assets*
Return on Equity**
* Net income / Total assets (average of
opening balance and ending balance)
**Net income / Owners' equity (average of
opening balance and ending balance)
Net Sales
(¥ billion)
0
100
200
300
400
500
600
700
201420132012
497.4516.1
616.8
Fiscal years ended March 31
421.5
62.4 62.0
278.8
Total assets (left)
Owners’ equity (left)
Total Assets & Owners’ Equity
Owners’ Equity Ratio
(¥ billion)
201420132012
(%)
0
100
200
300
400
500
0
20
40
60
80
100
370.9
62.3
231.4
As of March 31
Owners’ equity ratio (right)
470.0
308.3
Net income (left)
Net Income
Net Income per Share
(¥ billion)
0
5
10
15
20
25
30
201420132012
20
40
60
80
100
120
0
(yen)
Net income per share (right)
73.066.7
19.5 17.8
72.2
19.2
Fiscal years ended March 31
Dividends per share (left)
Dividends per Share
Payout Ratio
(¥)
0
5
10
15
20
25
30
201420132012
0
Payout ratio (right)
10
20
30
40
50
60
32.9 36.0
24.0 24.0
(%)
Fiscal years ended March 31
24.0
33.2
inancial Highlights
F