Brother International 2014 Annual Report Download - page 18
Download and view the complete annual report
Please find page 18 of the 2014 Brother International annual report below. You can navigate through the pages in the report by either clicking on the pages listed below, or by using the keyword search tool below to find specific information within the annual report.-
 1
1 -
2
-
3
-
4
-
5
-
6
-
7
-
 8
8 -
 9
9 -
 10
10 -
 11
11 -
 12
12 -
 13
13 -
 14
14 -
 15
15 -
 16
16 -
 17
17 -
 18
18 -
 19
19 -
 20
20 -
 21
21 -
 22
22 -
 23
23 -
 24
24 -
 25
25 -
 26
26 -
 27
27 -
 28
28 -
29
-
30
-
31
-
32
-
33
-
34
-
35
-
36
-
37
-
38
-
39
-
40
-
41
-
42
-
43
-
44
-
45
-
46
-
47
-
48
-
49
-
50
-
51
-
52
-
53
-
54
-
55
-
56
-
57
-
58
-
59
-
60
-
61
-
62
-
63
-
64
-
65
-
66
-
67
 |
 |

17
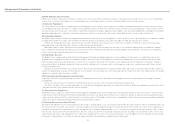
Business Overview
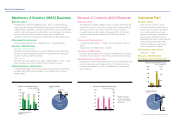
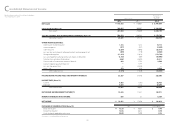
In fiscal 2013, net sales for the Brother Group rose by 19.5% year on year to ¥616,835 million. In addition to positive exchange rate effects from the yen’s depreciation, net sales
were lifted by several operational factors in the Americas and Asia, including China, notably robust performance from communications and printing equipment, a recovery in indus-
trial sewing machine demand, and beneficial effects from the consolidation of Nissei Corporation. Operating income increased by 45.4% year on year to ¥43,301 million, as posi-
tive exchange rate effects overcame lower earnings from the Network & Contents business. Net income increased by 7.8% year on year to ¥19,221 million reflecting the impact of
tax effect accounting.
Performance by Business Segment
For details about performance by business segment, please see “Review of Operations,” Pages 10-11.
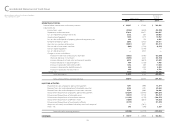
Fund Procurement, Liquidity and Cash Flows
The Brother Group’s financial policies ensure flexible and efficient funding and maintain an appropriate level of liquidity for current and future operating activities. In accordance with
these policies, we have created and operated a cash management system to optimize the group-wide use of cash held by individual companies. We also maintain open commit-
ment lines of credit with several banking institutions to complement existing liquidity on hand. Through these measures, we have established a system to correct the uneven distri-
bution of funds and minimize the overall borrowing needs of the Group.
Liquidity Management
The Group’s liquidity on hand consists of cash and cash equivalents and the unused portion of open commitment lines of credit. As of March 31, 2014, cash and cash equivalents
totaled ¥68,935 million.
We maintain open commitment lines of credit with several financial institutions for a combined amount of ¥20,000 million. The amount in open commitment lines of credit that
was unused as of March 31, 2014 was ¥88,934 million. Taking into consideration seasonal funding requirements, debt payable within one year and business environment risks, we
believe that we have sufficient liquidity on hand to support our operations through a whole year.
Fund Procurement
As a basic rule, we procure working capital and other short-term funding in short-term borrowings within one year that is funded with local currency. The basic policy on long-term
funding for manufacturing facilities is that funds should come from internal reserves, fixed-rate long-term debt and corporate bonds. As of March 31, 2014, short-term borrowings
stood at ¥1,467 million, primarily denominated in yen. The balance of unsecured loans from a bank was ¥12,900 million, all procured in fixed-rate debt procured in yen.
We have obtained credit ratings from Rating and Investment Information, Inc. (R&I). As of March 31, 2014, R&I assigned the Group’s long-term bonds and issuer credit “A”
ratings and its commercial paper an “a-1” rating. We consider consistent ratings important in maintaining our access to credit and capital markets.
The Brother Group believes that its liquidity on hand, including open commitment lines of credit, and sound corporate finance structure, on top of its ability to generate cash
flows from operating activities, make it possible to secure working capital as well as funds for capital investment and R&D investment to maintain the Group’s growth.
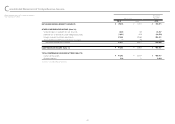
Cash Flows
Cash flows from operating activities
Net cash provided by operating activities amounted to ¥55,019 million, an increase of ¥22,285 million from ¥32,734 million in the previous year. In addition to an increase in income
before income taxes and others from the previous year, this growth primarily reflected an increase in trade notes and accounts payable.
Cash flows from investing activities
Net cash used in investing activities amounted to ¥39,100 million, ¥2,672 million less than ¥41,772 million used in the previous year. The decline in net cash used reflected a
decrease in disbursement for purchases of affiliates’ shares accompanying changes in the scope of consolidation, and offset an increase in disbursement for purchases of prop-
erty, plant and equipment.
Cash flows from financing activities
Net cash used in financing activities totaled ¥13,433 million, ¥7,019 million more than ¥6,413 million used in the previous year. Interest-bearing debt totaled an expenditure of
¥6,736 million, compared to income of ¥32 million a year earlier. Cash dividends paid was ¥6,687 million, on a par with the previous year.
497.4516.1
616.8
34.2
19.5
29.8
43.3
17.8 19.2
Net sales (left)
Operating income (right)
Net income (right)
Operating Results
(¥ billion) (¥ billion)
0
100
200
300
400
500
600
700
201420132012 0
10
20
30
40
50
60
70
Fiscal years ended March 31
Cash and Cash Equivalents,
End of Year
(¥ billion)
58.7 55.1
As of March 31
0
20
40
60
80
100
68.9
201420132012
Interest-bearing Debt
(¥ billion)
23.1 22.7
17.4
As of March 31
0
10
20
30
40
2013 20142012
anagement’s Discussion and Analysis
M