Westjet 2004 Annual Report Download - page 4
Download and view the complete annual report
Please find page 4 of the 2004 Westjet annual report below. You can navigate through the pages in the report by either clicking on the pages listed below, or by using the keyword search tool below to find specific information within the annual report.-
 1
1 -
 2
2 -
 3
3 -
 4
4 -
 5
5 -
 6
6 -
 7
7 -
 8
8 -
 9
9 -
 10
10 -
 11
11 -
 12
12 -
 13
13 -
 14
14 -
 15
15 -
16
-
17
-
18
-
19
-
20
-
21
-
22
-
23
-
24
-
25
-
26
-
27
-
28
-
29
-
30
-
31
-
32
-
33
-
34
-
35
-
36
-
37
-
38
-
39
-
40
-
41
-
42
-
43
-
44
-
45
-
46
-
47
-
48
-
49
-
50
-
51
-
52
-
53
-
54
-
55
-
56
-
57
-
58
-
59
-
60
-
61
-
62
-
63
-
64
 |
 |

WESTJET ANNUAL REPORT 2004
4
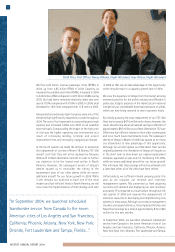
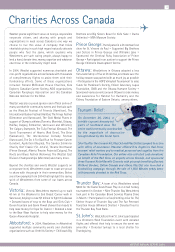
Shane Harney, Manager, Operations Control Centre
Sophie Ménard, Donations Coordinator
4
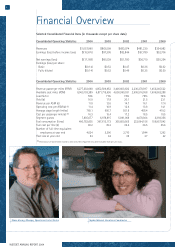
Selected Consolidated Financial Data (in thousands except per share data)
Consolidated Operating Statistics 2004 2003 2002 2001 2000
Revenues $1,057,990 $863,599 $683,074 $481,230 $334,982
Earnings (loss) before income taxes $(15,976) $97,395 $82,844 $57,789 $52,706
Net earnings (loss) $(17,168) $60,539 $51,780 $36,710 $30,254
Earnings (loss) per share:
Basic $(0.14) $0.52 $0.47 $0.36 $0.32
Fully diluted $(0.14) $0.52 $0.46 $0.35 $0.30
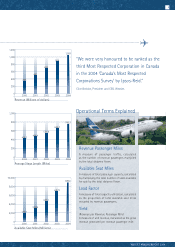
Consolidated Operating Statistics 2004 2003 2002 2001 2000
Revenue passenger miles (RPM) 6,277,332,668 4,852,506,652 3,406,663,632 2,236,270,397 1,453,245,522
Available seat miles (ASM) 8,963,103,389 6,871,715,636 4,650,990,031 2,995,516,958 1,906,863,288
Load factor 70% 71% 73% 75% 76%
Yield (¢) 16.9 17.8 20.1 21.5 23.1
Revenue per ASM (¢) 11.8 12.6 14.7 16.1 17.6
Operating cost per ASM (¢) (1) 11.4 10.9 12.6 13.8 14.1
Average stage length (miles) 760.1 656.7 551.8 458.4 419.2
Cost per passenger mile (¢) (1) 16.3 15.4 17.2 18.5 18.5
Segment guests 7,835,677 6,978,815 5,861,068 4,670,364 3,393,356
Fuel consumption (litres) 490,782,605 397,613,173 305,600,565 232,094,156 156,957,842
Fuel cost per litre (¢) 49.2 39.2 36.6 36.5 35.6
Number of full-time-equivalent
employees at year end 4,024 3,396 2,710 1,844 1,292
Fleet size at year end 54 44 35 27 22
(1) Write-down of $47,577,000 related to 200-series fleet impairment has been excluded from per-unit costs.
Financial Overview