Westjet 2004 Annual Report Download - page 23
Download and view the complete annual report
Please find page 23 of the 2004 Westjet annual report below. You can navigate through the pages in the report by either clicking on the pages listed below, or by using the keyword search tool below to find specific information within the annual report.-
 1
1 -
2
-
3
-
4
-
5
-
6
-
7
-
8
-
9
-
10
-
11
-
12
-
 13
13 -
 14
14 -
 15
15 -
 16
16 -
 17
17 -
 18
18 -
 19
19 -
 20
20 -
 21
21 -
 22
22 -
 23
23 -
 24
24 -
 25
25 -
 26
26 -
 27
27 -
 28
28 -
 29
29 -
 30
30 -
 31
31 -
 32
32 -
 33
33 -
34
-
35
-
36
-
37
-
38
-
39
-
40
-
41
-
42
-
43
-
44
-
45
-
46
-
47
-
48
-
49
-
50
-
51
-
52
-
53
-
54
-
55
-
56
-
57
-
58
-
59
-
60
-
61
-
62
-
63
-
64
 |
 |

WESTJET ANNUAL REPORT 2004
23
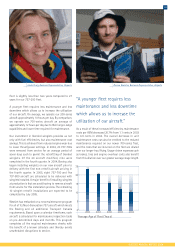
Expenses
Operating cost per available seat mile is a commonly
referenced measure when comparing our relative costs
year over year and comparing our performance to other
airlines. In 2004, total operating cost per available seat
mile, excluding the impact of the impairment loss,
increased by 4.6% to 11.4 cents from 10.9 cents in 2003.
Average stage length is defined as an airline's average
distance of flight and has a significant impact on an
airline's operating unit costs. As average stage length
increases, cost efficiencies are gained as the carrier is
able to achieve a lower average cost per mile since fixed
costs are shared over an increasing number of miles.
We increased our long-haul flights by 58% in 2004
from a year ago with medium- and short-haul flights
remaining relatively unchanged. As a result, our
average stage length increased from 656.7 miles in
2003 to 760.1 miles in 2004. We estimate that our
CASM should have decreased by approximately 7.5%
as a result of our longer-haul flying. However, the price
of oil over the past year has had a tremendous effect
on our operations. Fuel costs now comprise almost a
quarter of our operating expenses and the soaring fuel
price in 2004 is the largest single factor that
undermined the unit cost benefits we achieved from
longer-haul flying.
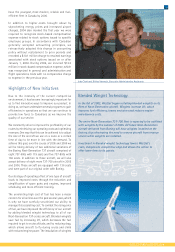
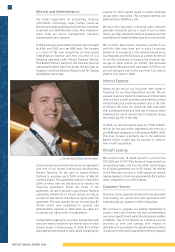
Aircraft Fuel
The results of our operations are highly vulnerable to
changes in fuel costs. In addition to replacing our
fleet with more fuel-efficient Next-Generation aircraft
at a faster pace, we also manage this expense with
the ongoing program of equipping our Boeing Next-
Generation aircraft with blended winglet technology.
This technology reduces fuel burn by increasing lift
and reducing drag, and this improved aerodynamic
efficiency has the ancillary benefit of increasing range
capabilities. As anticipated, we have realized reduced
fuel consumption from this initiative, which has
proven to be even more beneficial than originally
planned during these times of high energy prices.
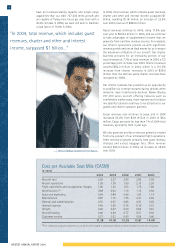
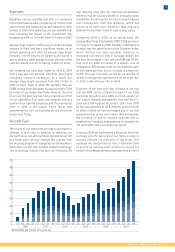
Comparing 2004 to 2003 on an annual basis, the
average West Texas Intermediate (“WTI”) US$ per barrel
of crude oil increased by 33%. Partially offsetting this
increase was the appreciation in the Canadian dollar,
which limited our year-over-year exposure to
increasing fuel costs to 24% in Canadian dollars. For
the year, the increase in fuel cost per ASM was 18.9%.
Fuel cost per ASM increased at a smaller rate as
compared to WTI because some jet fuel expenses, such
as into-plane services, do not increase in proportion
to WTI. On a per-litre basis, we did see an increase of
25.5% in average fuel expense from 39 cents per litre
in 2003 to 49 cents per litre in 2004.
A portion of the year-over-year increase in our fuel
cost per ASM can be attributed to part of our 2003
fuel being hedged. In June 2003, our fixed-volume jet
fuel supply hedging arrangement that had been in
place since 1999 expired. As a result, 12% of our 2003
jet fuel was protected at US $18.60 per barrel of crude
oil while in 2004 we had not hedged any of our fuel
requirements as prices were higher than anticipated.
We continue to look for feasible opportunities to
establish fuel-hedging arrangements to mitigate the
risk associated with increasing fuel prices.
In January 2004, we implemented a temporary tiered fuel
surcharge onto the base price of our flights in order to
partially alleviate the pressures of fuel prices. This
surcharge was merged into our fares in December 2004
as part of an industry-wide initiative to reduce the
number of surcharges and taxes associated with air travel.
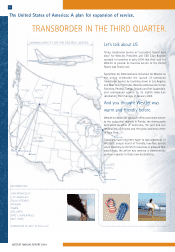
10
50
45
40
35
30
25
20
15
Q1
1999
WTI (US$) per barrel of crude oil
Q2 Q3 Q4 Q1
2000
Q2 Q3 Q4 Q1
2001
Q2 Q3 Q4 Q1
2002
Q2 Q3 Q4 Q1
2003
Q2 Q3 Q4 Q1
2004
Q2 Q3 Q4