Westjet 2004 Annual Report Download - page 35
Download and view the complete annual report
Please find page 35 of the 2004 Westjet annual report below. You can navigate through the pages in the report by either clicking on the pages listed below, or by using the keyword search tool below to find specific information within the annual report.-
 1
1 -
2
-
3
-
4
-
5
-
6
-
7
-
8
-
9
-
10
-
11
-
12
-
13
-
14
-
15
-
16
-
17
-
18
-
19
-
20
-
21
-
22
-
23
-
24
-
 25
25 -
 26
26 -
 27
27 -
 28
28 -
 29
29 -
 30
30 -
 31
31 -
 32
32 -
 33
33 -
 34
34 -
 35
35 -
 36
36 -
 37
37 -
 38
38 -
 39
39 -
 40
40 -
 41
41 -
 42
42 -
 43
43 -
 44
44 -
 45
45 -
46
-
47
-
48
-
49
-
50
-
51
-
52
-
53
-
54
-
55
-
56
-
57
-
58
-
59
-
60
-
61
-
62
-
63
-
64
 |
 |

WESTJET ANNUAL REPORT 2004
35
during December, and this was further exaggerated by
this year's relatively shorter Christmas holiday period.
Total operating revenue increased by 18.9% to $273.7
million in the last three months of 2004 compared to
$230.2 million in same period in 2003. Our fourth
quarter yield dropped by approximately 5.8% over the
same period last year.
Excluding the $47.6 million impairment loss included in
amortization expense, total CASM increased by 9.4%
for the three months ended December 31, 2004 to 11.7
cents compared to 10.7 cents in the fourth quarter of
the previous year. Our average stage length increased
from 684.7 miles in the last quarter of 2003 to 788.3
miles in the same period of 2004. We estimate the unit
cost benefit derived from this increased stage length to
be approximately 7%; however, persistent cost pressures
in the fourth quarter largely attributable to increases in
jet fuel prices and rising airport operation costs negated
the cost advantages we realized from increased long-
haul flying.
World fuel prices increased dramatically in the last three
months of the year with WTI US dollars per barrel of
crude increasing 54.9% and 10.2% over the fourth
quarter of 2003 and the third quarter of 2004
respectively. This significantly impacted our fuel cost
per litre which increased 47.4% from 37 cents per litre
in the fourth quarter of 2003 to 56 cents per litre in
the same period in 2004. The dramatic fuel price
escalation in the fourth quarter resulted in a 42.0%
increase in cost per ASM when compared to the fourth
quarter in 2003.
In the three months ended December 31, 2004, our
airport operations expanded to include seven
destinations in the United States (service to our eighth
United States destination, Palm Springs, began on
January 7, 2005). Additionally, our people opened
facilities for our guests in 15 additional charter cities
not previously served in the fourth quarter last year.
For the quarter, airport operations experienced a 9.0%
increase in cost per ASM compared to the same period
in 2003. Our cost per departure, which excludes any
impact from stage length dilution, increased by 23.2%
during the three-month period compared to the fourth
quarter of last year.
Airport operations witnessed increased costs in four key
areas. The most significant impact to operations was the
roughly 9.0% increase in airport rates and fees over the
same period in 2003. Additionally, we continued to grow
our operations in Toronto, Canada's most expensive
airport. For the three months ended December 31, 2004,
Toronto saw departure growth of almost 242%
compared to the same period in 2003. Furthermore, we
continued the growth of our Next-Generation 737-700
fleet, which increased the proportion of total flights
made by 700-series aircraft. As fees are generally linked
to the size of an aircraft, cost per departure increased
with the growth in percentage of total flights made by
737-700s. Finally, the expansion into the United States
that commenced in September 2004 resulted in
additional costs from our Canadian airports, as airports
charge elevated rates for international operations.
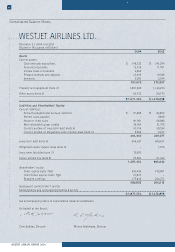
Financial Condition
Liquidity and Capital Resources
We ended 2004 with a solid cash position of $148.5 million
compared to $241.4 million in 2003. We completed the
year with a working capital ratio of 0.6 compared to 1.2
at the end of the previous year. The decrease in our cash
position and working capital ratio was primarily due to
the decrease in operating cash flow as a result of the weak
yield environment and high fuel prices and airport costs.
In addition, as we take on additional debt from purchases
of Next-Generation aircraft, our current liabilities will
increase as a result of an increase in obligations due within
the upcoming year.
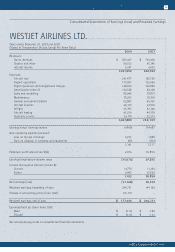
Operating cash, derived primarily from providing air
transportation to our guests through our operating
activities, continues to generate stable cash flow. Operating
cash outflows are primarily related to the recurring
expenses of operating the airline. During the 12-months
ended December 31, 2004, we produced $144.1 million
cash from operations compared to $192.4 million in the
previous year. For 2004, the decrease in operating cash
flows primarily was a result of lower fare revenue realized
on ticket sales.
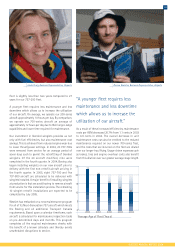
Joanne Leskow, Team Leader, CARE