Westjet 2004 Annual Report Download - page 21
Download and view the complete annual report
Please find page 21 of the 2004 Westjet annual report below. You can navigate through the pages in the report by either clicking on the pages listed below, or by using the keyword search tool below to find specific information within the annual report.-
 1
1 -
2
-
3
-
4
-
5
-
6
-
7
-
8
-
9
-
10
-
 11
11 -
 12
12 -
 13
13 -
 14
14 -
 15
15 -
 16
16 -
 17
17 -
 18
18 -
 19
19 -
 20
20 -
 21
21 -
 22
22 -
 23
23 -
 24
24 -
 25
25 -
 26
26 -
 27
27 -
 28
28 -
 29
29 -
 30
30 -
 31
31 -
32
-
33
-
34
-
35
-
36
-
37
-
38
-
39
-
40
-
41
-
42
-
43
-
44
-
45
-
46
-
47
-
48
-
49
-
50
-
51
-
52
-
53
-
54
-
55
-
56
-
57
-
58
-
59
-
60
-
61
-
62
-
63
-
64
 |
 |

WESTJET ANNUAL REPORT 2004
21
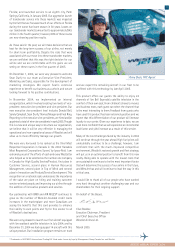
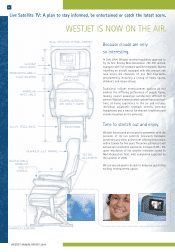
from $1 to $5, and include sandwiches, fruit bowls,
and non-perishable snacks. Though this initiative is
primarily driven by our desire to increase our level of
customer service, selling food onboard flights also
generates positive revenues. We will, however, continue
to offer complimentary snacks and non-alcoholic
beverages on all of our flights.
Selected Annual and
Quarterly Information
The tables below (“Annual audited financial
information” and “Quarterly unaudited financial
information”) set forth selected data derived from our
consolidated financial statements for the three years
ended December 31 and the eight previous quarters
ended December 31, 2004. These tables have been
prepared in accordance with Canadian generally
accepted accounting principles and are reported in
Canadian dollars. This information should be read in
conjunction with the consolidated financial
statements for the year ended December 31, 2004
and related notes thereto.
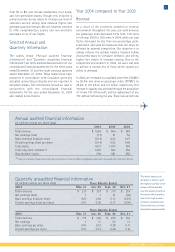
Year 2004 compared to Year 2003
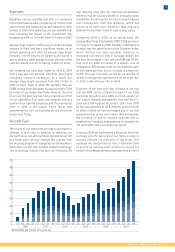
Revenue
As a result of the extremely competitive revenue
environment throughout the year, our yield (revenue
per passenger mile) decreased 5.1% from 17.8 cents
in full-year 2003 to 16.9 cents in 2004, while our load
factor decreased by less than one-percentage point.
Load factor and yield are measures that can easily be
affected by external competition. Our objective is to
always achieve the optimal balance between selling
discounted seats to stimulate demand, and selling
higher-fare tickets to increase revenue. Due to the
competitive environment in 2004, we were less able
to achieve a normal mix of fares which caused our
yields to decrease.
In 2004, we increased our available seat miles (“ASMs”)
by 30.4% and revenue passenger miles (“RPMs”) by
29.4% to 9.0 billion and 6.3 billion respectively. This
increase in capacity was achieved through the acquisition
of 11 new 737-700 aircraft, and the replacement of one
737-200 aircraft during the year. These new aircraft also
Annual audited financial information
(in millions except per share data)
2004 2003 2002
Total revenue $ 1,058 $ 864 $ 683
Net earnings (loss) (17) 61 52
Basic earnings (loss) per share (0.14) 0.52 0.47
Diluted earnings (loss) per share (0.14) 0.52 0.46
Total assets 1,877 1,477 784
Total long-term liabilities (1) 1,020 662 255
Shareholders’ equity 590 581 356
(1) Long-term liabilities include current and long-term portions of long-term debt and obligations under capital leases and other long-term liabilities.
Quarterly unaudited financial information
(in millions except per share data) Three Months Ended
2004 Mar. 31 Jun. 30 Sept. 30 Dec. 31
Total revenues $ 217 $ 257 $ 310 $ 274
Net earnings (loss) 1 7 21 (46)
Basic earnings (loss) per share 0.01 0.06 0.17 (0.37)
Diluted earnings (loss) per share 0.01 0.06 0.17 (0.36)
Three Months Ended
2003 Mar. 31 Jun. 30 Sept. 30 Dec. 31
Total revenues $ 173 $ 206 $ 255 $ 230
Net earnings 1 15 32 13
Basic earnings per share 0.01 0.13 0.28 0.11
Diluted earnings per share 0.01 0.13 0.28 0.10
The airline business is
seasonal in nature, with
the highest activity in the
summer (third quarter)
and the lowest activity in
the winter (first quarter)
due to the high number
of leisure travellers and
their preference to travel
during the summer months.