Westjet 2004 Annual Report Download - page 22
Download and view the complete annual report
Please find page 22 of the 2004 Westjet annual report below. You can navigate through the pages in the report by either clicking on the pages listed below, or by using the keyword search tool below to find specific information within the annual report.-
 1
1 -
2
-
3
-
4
-
5
-
6
-
7
-
8
-
9
-
10
-
11
-
 12
12 -
 13
13 -
 14
14 -
 15
15 -
 16
16 -
 17
17 -
 18
18 -
 19
19 -
 20
20 -
 21
21 -
 22
22 -
 23
23 -
 24
24 -
 25
25 -
 26
26 -
 27
27 -
 28
28 -
 29
29 -
 30
30 -
 31
31 -
 32
32 -
33
-
34
-
35
-
36
-
37
-
38
-
39
-
40
-
41
-
42
-
43
-
44
-
45
-
46
-
47
-
48
-
49
-
50
-
51
-
52
-
53
-
54
-
55
-
56
-
57
-
58
-
59
-
60
-
61
-
62
-
63
-
64
 |
 |

WESTJET ANNUAL REPORT 2004
22
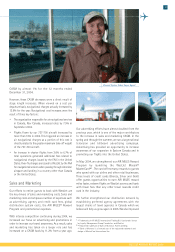
have an increased seating capacity and longer-range
capabilities than our older 737-200 series aircraft and
are capable of flying more hours per year. Even with a
30.4% increase in ASMs, we were still able to maintain
a load factor of 70.0% in 2004.
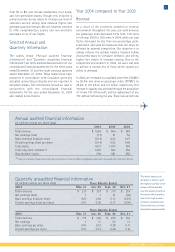
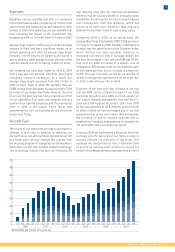
In 2004, total revenue, which includes guest revenues,
charter and other and interest income, surpassed $1
billion, reaching $1.06 billion, an increase of 22.5%
over 2003 revenue of $863.6 million.
Guest revenues continue to climb, rising 17.5% year
over year to $933.4 million in 2004, and we continue
to take advantage of supplemental income that we
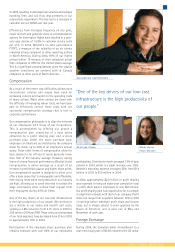
generate from ancillary revenue sources. For example,
our charter operations provide us with significant
revenue growth and are an ideal means for us to ensure
the maximum utilization of our aircraft. Our charter
business accounts for an increasing portion of our
total revenues at 7.7% of total revenues in 2004, a 3.3
percentage point increase over 2003. Charter revenues
totalled $82.0 million in 2004, which is a 115.5%
increase from charter revenues in 2003 of $38.0
million. Over the last two years, charter revenues have
increased by 360%.
Our charter business has provided us an opportunity
to stabilize our revenue streams during periods when
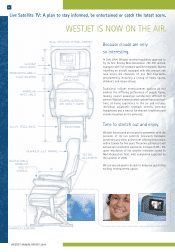
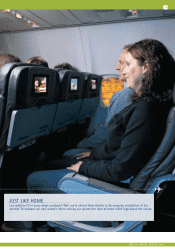
domestic travel traditionally declines. Newer Boeing
737-700 series aircraft offering features such as
comfortable leather seats, more legroom and exclusive
live satellite television continue to be attractive to our
guests and charter-operator partners.
Cargo revenues also continue to grow, and in 2004
increased 66.4% from $3.8 million in 2003 to $6.4
million. Cargo accounts for less than 1% of 2004 total
revenues, up slightly from a year ago.
We also generate ancillary revenues primarily created
from a by-product of our scheduled flight operations.
Other revenue originates primarily from guest itinerary
changes and excess baggage fees. Other revenue
totalled $25.6 million in 2004, an increase of 28.4%
over 2003.
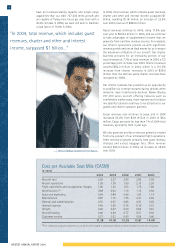
Cost per Available Seat Mile (CASM)
in cents
2004 2003 2002 2001 2000
Aircraft fuel 2.69 2.27 2.40 2.83 2.93
Airport operations 1.93 1.78 1.90 2.13 2.20
Flight operations and navigational charges 1.66 1.53 1.63 1.76 1.86
Amortization (1) 0.88 0.92 1.13 1.15 0.94
Sales and marketing 0.94 0.84 0.96 1.03 1.14
Maintenance 0.87 1.10 1.76 2.41 2.60
General and administration 0.70 0.67 0.86 0.70 0.63
Interest expense 0.49 0.36 0.16 0.16 0.15
Inflight 0.49 0.47 0.59 0.54 0.61
Aircraft leasing 0.46 0.64 0.77 0.51 0.36
Customer service 0.27 0.32 0.43 0.59 0.66
11.38 10.90 12.59 13.81 14.08
(1) For comparative purposes, impairment loss of $47,577,000 included in amortization expense has been excluded from unit cost calculations.
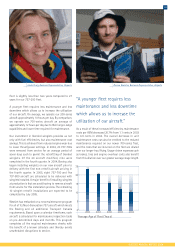
“In 2004, total revenue, which includes guest
revenues, charter and other and interest
income, surpassed $1 billion…”
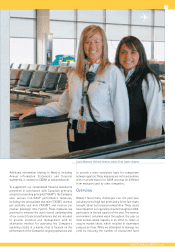
Patrick Sabbag, Customer Service Agent