Westjet 2002 Annual Report Download - page 25
Download and view the complete annual report
Please find page 25 of the 2002 Westjet annual report below. You can navigate through the pages in the report by either clicking on the pages listed below, or by using the keyword search tool below to find specific information within the annual report.-
 1
1 -
2
-
3
-
4
-
5
-
6
-
7
-
8
-
9
-
10
-
11
-
12
-
13
-
14
-
 15
15 -
 16
16 -
 17
17 -
 18
18 -
 19
19 -
 20
20 -
 21
21 -
 22
22 -
 23
23 -
 24
24 -
 25
25 -
 26
26 -
 27
27 -
 28
28 -
 29
29 -
 30
30 -
 31
31 -
 32
32 -
 33
33 -
 34
34 -
 35
35 -
36
-
37
-
38
-
39
-
40
-
41
-
42
-
43
-
44
-
45
-
46
-
47
-
48
-
49
-
50
-
51
-
52
-
53
-
54
-
55
-
56
-
57
-
58
-
59
-
60
 |
 |
2002 WestJet Annual Report 25
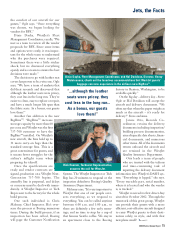
We continue to contract with
tour operators for off-peak
hour charter flying to a vari-
ety of vacation spots, which improves
aircraft and crew utilization and pro-
vides positive net profit to the company.
Charter revenue increased 76.2% from
$10.1 million in 2001 to $17.8 million
in 2002. In 2002 charter revenue
increased to 2.6% of total revenue
compared to 2.1% of total revenue in
2001. Revenue from cargo operations
was up 50.0% to $2.4 million in 2002
from $1.6 million in 2001. Cargo rev-
enue provides incremental revenue, and
will continue to grow at a greater rate
than our scheduled domestic revenues
as we expand our network and fleet.
With significant year-over-year
capacity growth and despite the des-
timulative effect of the federal govern-
ment’s Air Traveller’s Security Charge,
our load factor remained strong at
73.2%, slightly down from 74.7% in
2001. This indicates Canadians
embraced our product as travellers
absorbed the bulk of our 55% capacity
increase during 2002.
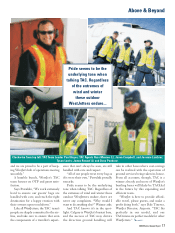
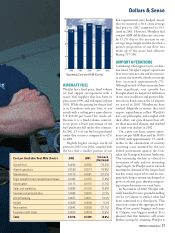
WestJet continues to be innovative
and proactive, and in July led the indus-
try in Canada with the introduction of
a three-tiered fee structure, based on
distance flown, for the surcharge levied
by Nav Canada. In January 2003, we
implemented a similar structure of a
$5, $7, and $10 temporary fuel sur-
charge, depending on length of flight,
which was increased to $10, $14, and
$20 in March of 2003. These charges,
as well as the levy for insurance, are
included in our revenues to compen-
sate for increased costs.
As in the past, we continue to grow
our capacity as we add new Next-
Generation 737-700 aircraft to our fleet
and build our network. In keeping with
our strategy of increasing long-haul fly-
ing, our average stage length increased
20.5% from 458 miles in 2001 to 552
miles in 2002. Contributing to our
increased stage length, was our expan-
sion into the Toronto and London,
Ontario markets. By adding these mar-
kets with service to and from western
Canada, we increased our eastern brand
awareness, giving us a stronger plat-
form to continue growing our presence
in this more heavily populated area of
Canada.
As would be expected with our
increasing stage length, costs and rev-
enues on a unit basis declined. We
estimate that this increase in stage
length caused an approximate 7.7%
decline in unit measures of revenue and
costs. Revenue per ASM for the year
declined by 8.8% from 16.0 cents in
2001 to 14.6 cents in 2002 due to the
impact of new fees, taxes, and the
aggressive competitive landscape.
Revenue per passenger mile, or yield,
declined 6.5% from 21.4 cents in 2001
to 20.0 cents in 2002.
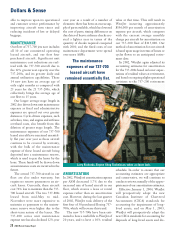
Pilot John Swallow and Flight Attendant Laura Maguire
prepare for another fun WestJet flight.
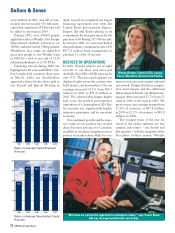
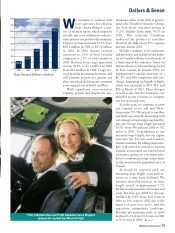
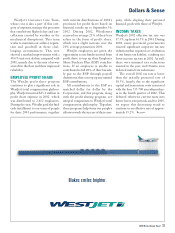
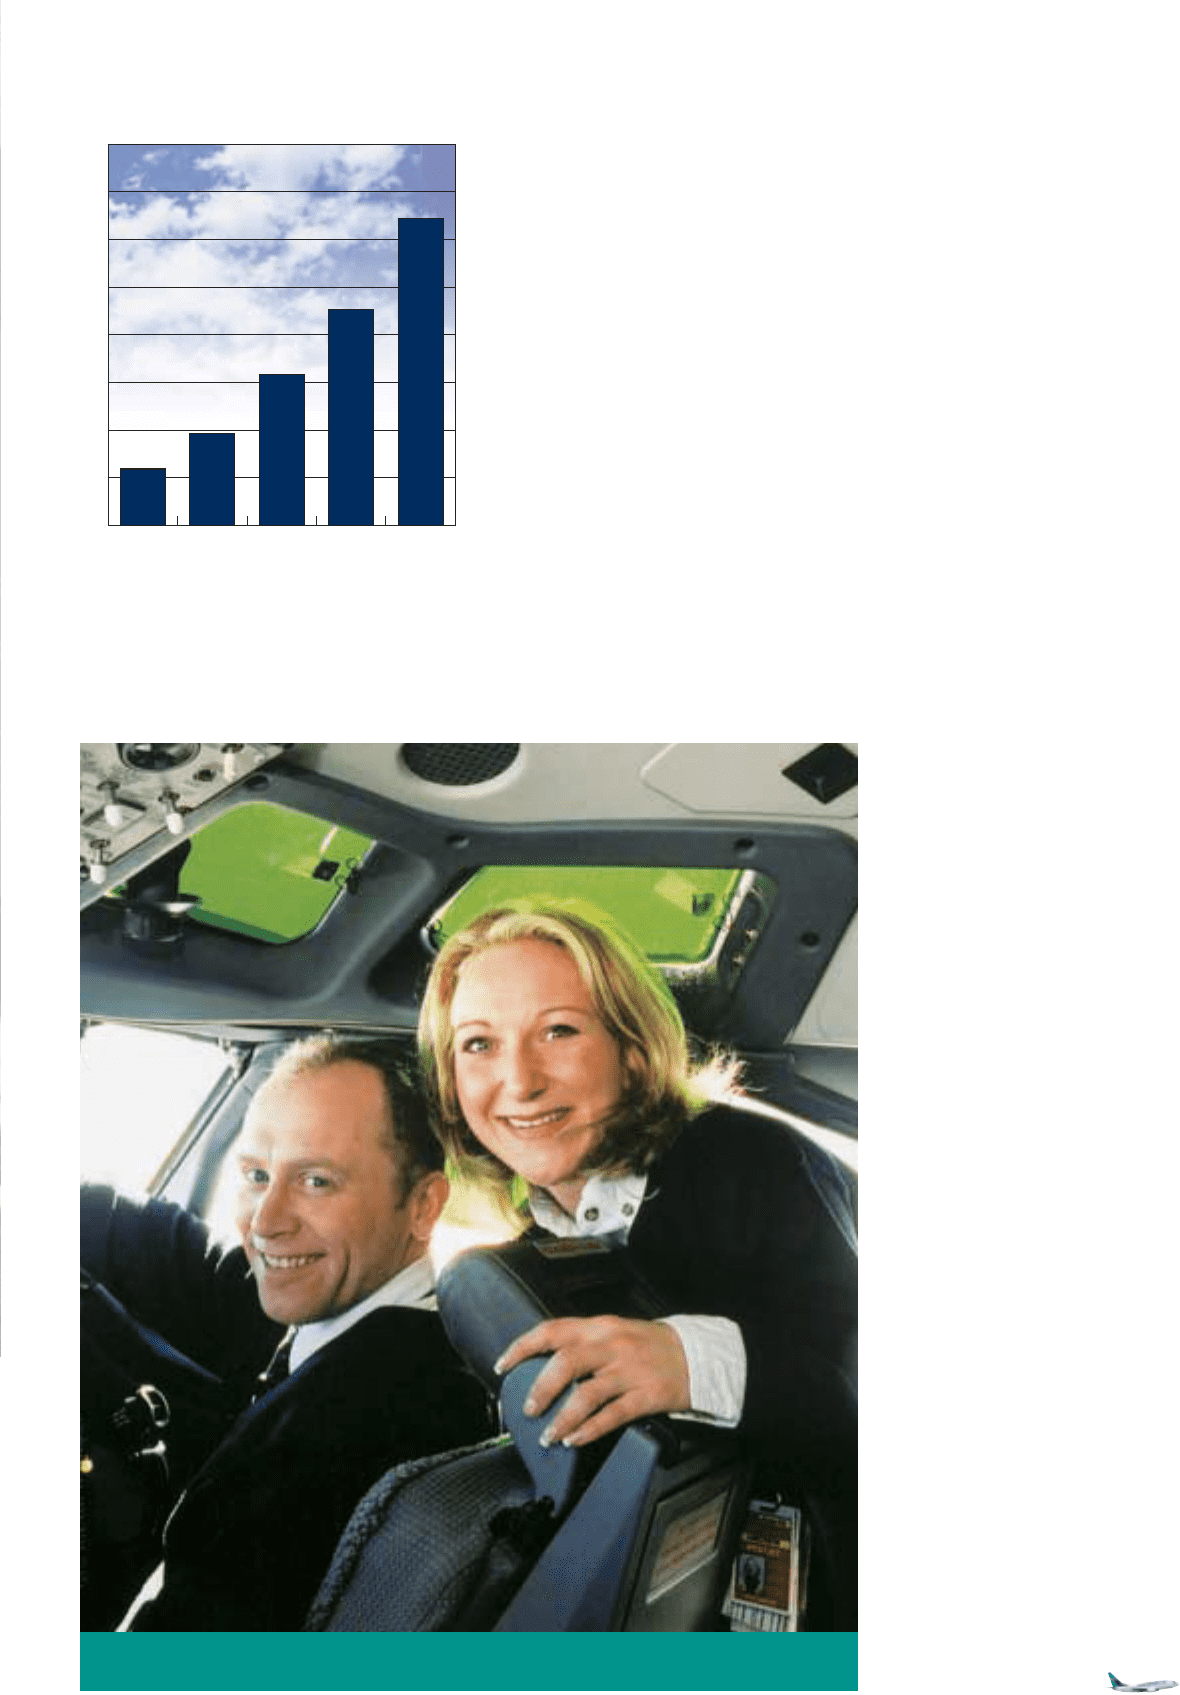
Guest Revenue (Millions of dollars)
0
100
200
300
400
500
600
700
800
118.6
193.7
315.9
452.9
643.2
1998 1999 2000 2001 2002
Dollars & Sense