United Healthcare 2013 Annual Report Download - page 85
Download and view the complete annual report
Please find page 85 of the 2013 United Healthcare annual report below. You can navigate through the pages in the report by either clicking on the pages listed below, or by using the keyword search tool below to find specific information within the annual report.-
 1
1 -
2
-
3
-
4
-
5
-
6
-
7
-
8
-
9
-
10
-
11
-
12
-
13
-
14
-
15
-
16
-
17
-
18
-
19
-
20
-
21
-
22
-
23
-
24
-
25
-
26
-
27
-
28
-
29
-
30
-
31
-
32
-
33
-
34
-
35
-
36
-
37
-
38
-
39
-
40
-
41
-
42
-
43
-
44
-
45
-
46
-
47
-
48
-
49
-
50
-
51
-
52
-
53
-
54
-
55
-
56
-
57
-
58
-
59
-
60
-
61
-
62
-
63
-
64
-
65
-
66
-
67
-
68
-
69
-
70
-
71
-
72
-
73
-
74
-
 75
75 -
 76
76 -
 77
77 -
 78
78 -
 79
79 -
 80
80 -
 81
81 -
 82
82 -
 83
83 -
 84
84 -
 85
85 -
 86
86 -
 87
87 -
 88
88 -
 89
89 -
 90
90 -
 91
91 -
 92
92 -
 93
93 -
 94
94 -
 95
95 -
96
-
97
-
98
-
99
-
100
-
101
-
102
-
103
-
104
-
105
-
106
-
107
-
108
-
109
-
110
-
111
-
112
-
113
-
114
-
115
-
116
-
117
-
118
-
119
-
120
 |
 |

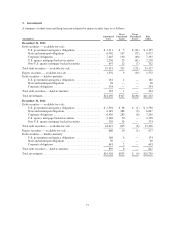
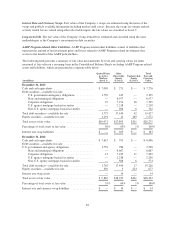
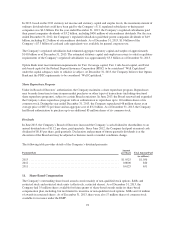
The following table presents a summary of fair value measurements by level and carrying values for certain
financial instruments not measured at fair value on a recurring basis in the Consolidated Balance Sheets:
(in millions)
Quoted Prices
in Active
Markets
(Level 1)
Other
Observable
Inputs
(Level 2)
Unobservable
Inputs
(Level 3)
Total
Fair
Value
Total
Carrying
Value
December 31, 2013
Debt securities—held-to-maturity:
U.S. government and agency obligations .... $182 $ — $ — $ 182 $ 181
State and municipal obligations ............ — — 28 28 28
Corporate obligations ................... 47 9 278 334 334
Total debt securities—held-to-maturity ......... $229 $ 9 $306 $ 544 $ 543
Long-term debt and other financing obligations . . . $ — $16,602 $ — $16,602 $15,745
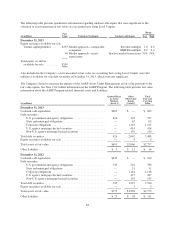
December 31, 2012
Debt securities—held-to-maturity:
U.S. government and agency obligations .... $174 $ — $ — $ 174 $ 168
State and municipal obligations ............ — 1 29 30 30
Corporate obligations ................... 10 346 287 643 641
Total debt securities—held-to-maturity ......... $184 $ 347 $316 $ 847 $ 839
Long-term debt ............................ $ — $17,034 $ — $17,034 $15,167
The carrying amounts reported in the Consolidated Balance Sheets for other current financial assets and
liabilities approximate fair value because of their short-term nature. These assets and liabilities are not listed in
the table above.
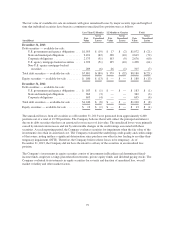
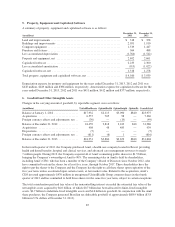
A reconciliation of the beginning and ending balances of assets measured at fair value on a recurring basis using
Level 3 inputs is as follows:
December 31, 2013 December 31, 2012 December 31, 2011
(in millions)
Debt
Securities
Equity
Securities Total
Debt
Securities
Equity
Securities Total
Debt
Securities
Equity
Securities Total
Balance at beginning of period ..... $17 $224 $241 $ 208 $209 $ 417 $141 $208 $349
Purchases ..................... 38 71 109 11 71 82 92 35 127
Sales ......................... (10) (25) (35) — (34) (34) — (17) (17)
Settlements .................... — — — (1) — (1) (25) (7) (32)
Net unrealized losses in accumulated
other comprehensive income .... (2) (7) (9) — (14) (14) — (4) (4)
Net realized (losses) gains in
investment and other income .... (1) 6 5 — 13 13 — (6) (6)
Transfers to held-to-maturity ...... — — — (201) (21) (222) — — —
Balance at end of period .......... $42 $269 $311 $ 17 $224 $ 241 $208 $209 $417
83