United Healthcare 2013 Annual Report Download - page 47
Download and view the complete annual report
Please find page 47 of the 2013 United Healthcare annual report below. You can navigate through the pages in the report by either clicking on the pages listed below, or by using the keyword search tool below to find specific information within the annual report.-
 1
1 -
2
-
3
-
4
-
5
-
6
-
7
-
8
-
9
-
10
-
11
-
12
-
13
-
14
-
15
-
16
-
17
-
18
-
19
-
20
-
21
-
22
-
23
-
24
-
25
-
26
-
27
-
28
-
29
-
30
-
31
-
32
-
33
-
34
-
35
-
36
-
 37
37 -
 38
38 -
 39
39 -
 40
40 -
 41
41 -
 42
42 -
 43
43 -
 44
44 -
 45
45 -
 46
46 -
 47
47 -
 48
48 -
 49
49 -
 50
50 -
 51
51 -
 52
52 -
 53
53 -
 54
54 -
 55
55 -
 56
56 -
 57
57 -
58
-
59
-
60
-
61
-
62
-
63
-
64
-
65
-
66
-
67
-
68
-
69
-
70
-
71
-
72
-
73
-
74
-
75
-
76
-
77
-
78
-
79
-
80
-
81
-
82
-
83
-
84
-
85
-
86
-
87
-
88
-
89
-
90
-
91
-
92
-
93
-
94
-
95
-
96
-
97
-
98
-
99
-
100
-
101
-
102
-
103
-
104
-
105
-
106
-
107
-
108
-
109
-
110
-
111
-
112
-
113
-
114
-
115
-
116
-
117
-
118
-
119
-
120
 |
 |

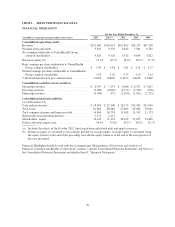
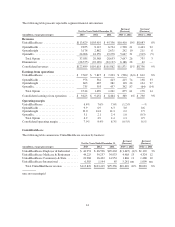
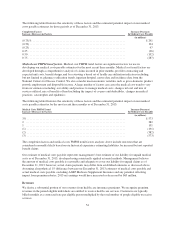
The following table summarizes the number of individuals served by our UnitedHealthcare businesses, by major
market segment and funding arrangement:
December 31,
Increase/
(Decrease)
Increase/
(Decrease)
(in thousands, except percentages) 2013 2012 2011 2013 vs. 2012 2012 vs. 2011
Commercial risk-based ......................... 8,185 9,340 9,550 (1,155) (12)% (210) (2)%
Commercial fee-based .......................... 19,055 17,585 16,320 1,470 8 1,265 8
Commercial fee-based TRICARE ................. 2,920 — — 2,920 nm — nm
Total commercial .............................. 30,160 26,925 25,870 3,235 12 1,055 4
Medicare Advantage ........................... 2,990 2,565 2,165 425 17 400 18
Medicaid .................................... 4,035 3,830 3,600 205 5 230 6
Medicare Supplement (Standardized) .............. 3,455 3,180 2,935 275 9 245 8
Total public and senior ......................... 10,480 9,575 8,700 905 9 875 10
International .................................. 4,805 4,425 — 380 9 4,425 nm
Total UnitedHealthcare — medical ................ 45,445 40,925 34,570 4,520 11% 6,355 18%
Supplemental Data:
Medicare Part D stand-alone ................... 4,950 4,225 4,855 725 17% (630) (13)%
nm = not meaningful
The number of people served under commercial risk-based arrangements decreased in 2013 primarily due to the
conversion of 1.1 million risk-based consumers of a large public sector client to a fee-based arrangement. The
number of individuals in commercial fee-based arrangements increased due to this conversion as well as new
business awards and strong customer retention. On April 1, 2013, UnitedHealthcare Military & Veterans began
service under the TRICARE West Region Managed Care Support Contract. This administrative services contract
for health care operations added 2.9 million people and includes a transition period and five one-year renewals at
the government’s option. Medicare Advantage participation increased due to solid execution in product design,
marketing and local engagement, which drove sales growth. Medicaid growth was due to a combination of
winning new state accounts and growth within existing state customers, partially offset by the first quarter 2013
divestiture of our Medicaid business in South Carolina and a fourth quarter 2012 market withdrawal from one
product in Wisconsin, which combined affected 235,000 Medicaid beneficiaries. Medicare Supplement growth
reflected strong customer retention and new sales. In our Medicare Part D stand-alone business, the number of
people served increased primarily as a result of new product introductions and strong customer retention in the
market. International represents commercial customers in Brazil added in the fourth quarter of 2012 as a result of
the Amil acquisition, and subsequent organic growth.
UnitedHealthcare’s revenue growth in 2013 was primarily attributable to the impact of 2012 acquisitions and the
growth in the number of individuals served. The effect of these factors was partially offset by the government
funding reductions described previously and the customer funding conversion discussed above.
UnitedHealthcare’s earnings from operations and operating margins in 2013 decreased compared to the prior
year as operating margins were pressured by the funding reductions that decreased revenues and by decreased
levels of favorable reserve development.
Optum
Total revenues increased in 2013 primarily due to broad-based growth across Optum’s services portfolio with
growth in each of Optum’s major businesses led by pharmacy growth from the insourcing of UnitedHealthcare
commercial customers and external clients.
45