United Healthcare 2013 Annual Report Download - page 35
Download and view the complete annual report
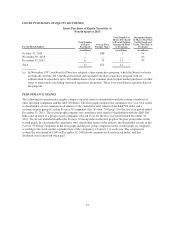
Please find page 35 of the 2013 United Healthcare annual report below. You can navigate through the pages in the report by either clicking on the pages listed below, or by using the keyword search tool below to find specific information within the annual report.-
 1
1 -
2
-
3
-
4
-
5
-
6
-
7
-
8
-
9
-
10
-
11
-
12
-
13
-
14
-
15
-
16
-
17
-
18
-
19
-
20
-
21
-
22
-
23
-
24
-
 25
25 -
 26
26 -
 27
27 -
 28
28 -
 29
29 -
 30
30 -
 31
31 -
 32
32 -
 33
33 -
 34
34 -
 35
35 -
 36
36 -
 37
37 -
 38
38 -
 39
39 -
 40
40 -
 41
41 -
 42
42 -
 43
43 -
 44
44 -
 45
45 -
46
-
47
-
48
-
49
-
50
-
51
-
52
-
53
-
54
-
55
-
56
-
57
-
58
-
59
-
60
-
61
-
62
-
63
-
64
-
65
-
66
-
67
-
68
-
69
-
70
-
71
-
72
-
73
-
74
-
75
-
76
-
77
-
78
-
79
-
80
-
81
-
82
-
83
-
84
-
85
-
86
-
87
-
88
-
89
-
90
-
91
-
92
-
93
-
94
-
95
-
96
-
97
-
98
-
99
-
100
-
101
-
102
-
103
-
104
-
105
-
106
-
107
-
108
-
109
-
110
-
111
-
112
-
113
-
114
-
115
-
116
-
117
-
118
-
119
-
120
 |
 |

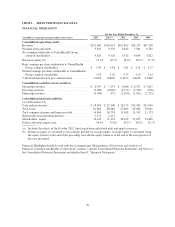
ISSUER PURCHASES OF EQUITY SECURITIES
Issuer Purchases of Equity Securities (a)
Fourth Quarter 2013
For the Month Ended
Total Number
of Shares
Purchased
Average Price
Paid per Share
Total Number of
Shares Purchased
as Part of Publicly
Announced Plans
or Programs
Maximum Number
of Shares That May
Yet Be Purchased
Under The Plans or
Programs
(in millions) (in millions) (in millions)
October 31, 2013 ....................... 1 $68 1 94
November 30, 2013 ..................... — — — 94
December 31, 2013 ..................... 11 71 11 83
Total ................................ 12 $71 12
(a) In November 1997, our Board of Directors adopted a share repurchase program, which the Board evaluates
periodically. In June 2013, the Board renewed and expanded our share repurchase program with an
authorization to repurchase up to 110 million shares of our common stock in open market purchases or other
types of transactions (including structured repurchase programs). There is no established expiration date for
the program.
PERFORMANCE GRAPHS
The following two performance graphs compare our total return to shareholders with the returns of indexes of
other specified companies and the S&P 500 Index. The first graph compares the cumulative five-year total return
to shareholders on our common stock relative to the cumulative total returns of the S&P 500 index and a
customized peer group of certain Fortune 50 companies (the “Fortune 50 Group”) for the five-year period ended
December 31, 2013. The second graph compares our cumulative total return to shareholders with the S&P 500
Index and an index of a group of peer companies selected by us for the five-year period ended December 31,
2013. We are not included in either the Fortune 50 Group index in the first graph or the peer group index in the
second graph. In calculating the cumulative total shareholder return of the indexes, the shareholder returns of the
Fortune 50 Group companies in the first graph and the peer group companies in the second graph are weighted
according to the stock market capitalizations of the companies at January 1 of each year. The comparisons
assume the investment of $100 on December 31, 2008 in our common stock and in each index, and that
dividends were reinvested when paid.
33