United Healthcare 2013 Annual Report Download - page 46
Download and view the complete annual report
Please find page 46 of the 2013 United Healthcare annual report below. You can navigate through the pages in the report by either clicking on the pages listed below, or by using the keyword search tool below to find specific information within the annual report.-
 1
1 -
2
-
3
-
4
-
5
-
6
-
7
-
8
-
9
-
10
-
11
-
12
-
13
-
14
-
15
-
16
-
17
-
18
-
19
-
20
-
21
-
22
-
23
-
24
-
25
-
26
-
27
-
28
-
29
-
30
-
31
-
32
-
33
-
34
-
35
-
 36
36 -
 37
37 -
 38
38 -
 39
39 -
 40
40 -
 41
41 -
 42
42 -
 43
43 -
 44
44 -
 45
45 -
 46
46 -
 47
47 -
 48
48 -
 49
49 -
 50
50 -
 51
51 -
 52
52 -
 53
53 -
 54
54 -
 55
55 -
 56
56 -
57
-
58
-
59
-
60
-
61
-
62
-
63
-
64
-
65
-
66
-
67
-
68
-
69
-
70
-
71
-
72
-
73
-
74
-
75
-
76
-
77
-
78
-
79
-
80
-
81
-
82
-
83
-
84
-
85
-
86
-
87
-
88
-
89
-
90
-
91
-
92
-
93
-
94
-
95
-
96
-
97
-
98
-
99
-
100
-
101
-
102
-
103
-
104
-
105
-
106
-
107
-
108
-
109
-
110
-
111
-
112
-
113
-
114
-
115
-
116
-
117
-
118
-
119
-
120
 |
 |

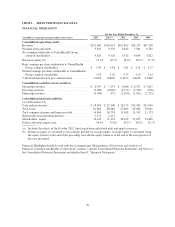
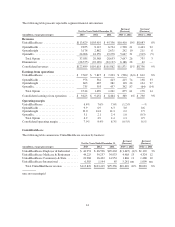
The following table presents reportable segment financial information:
For the Years Ended December 31,
Increase/
(Decrease)
Increase/
(Decrease)
(in millions, except percentages) 2013 2012 2011 2013 vs. 2012 2012 vs. 2011
Revenues
UnitedHealthcare ..................... $113,829 $103,419 $ 95,336 $10,410 10% $8,083 8%
OptumHealth ......................... 9,855 8,147 6,704 1,708 21 1,443 22
OptumInsight ........................ 3,174 2,882 2,671 292 10 211 8
OptumRx ............................ 24,006 18,359 19,278 5,647 31 (919) (5)
Total Optum ....................... 37,035 29,388 28,653 7,647 26 735 3
Eliminations ......................... (28,375) (22,189) (22,127) 6,186 28 62 —
Consolidated revenues ................. $122,489 $110,618 $101,862 $11,871 11% $8,756 9%
Earnings from operations
UnitedHealthcare ..................... $ 7,309 $ 7,815 $ 7,203 $ (506) (6)% $ 612 8%
OptumHealth ......................... 976 561 423 415 74 138 33
OptumInsight ........................ 603 485 381 118 24 104 27
OptumRx ............................ 735 393 457 342 87 (64) (14)
Total Optum ....................... 2,314 1,439 1,261 875 61 178 14
Consolidated earnings from operations . . . . $ 9,623 $ 9,254 $ 8,464 $ 369 4% $ 790 9%
Operating margin
UnitedHealthcare ..................... 6.4% 7.6% 7.6% (1.2)% —%
OptumHealth ......................... 9.9 6.9 6.3 3.0 0.6
OptumInsight ........................ 19.0 16.8 14.3 2.2 2.5
OptumRx ............................ 3.1 2.1 2.4 1.0 (0.3)
Total Optum ....................... 6.2 4.9 4.4 1.3 0.5
Consolidated operating margin ........... 7.9% 8.4% 8.3% (0.5)% 0.1%
UnitedHealthcare
The following table summarizes UnitedHealthcare revenue by business:
For the Years Ended December 31,
Increase/
(Decrease)
Increase/
(Decrease)
(in millions, except percentages) 2013 2012 2011 2013 vs. 2012 2012 vs. 2011
UnitedHealthcare Employer & Individual ..... $ 44,951 $ 46,596 $45,404 $ (1,645) (4)% $1,192 3%
UnitedHealthcare Medicare & Retirement .... 44,225 39,257 34,933 4,968 13 4,324 12
UnitedHealthcare Community & State ....... 18,268 16,422 14,954 1,846 11 1,468 10
UnitedHealthcare International ............. 6,385 1,144 45 5,241 nm 1,099 nm
Total UnitedHealthcare revenue .......... $113,829 $103,419 $95,336 $10,410 10% $8,083 8%
nm= not meaningful
44