United Healthcare 2013 Annual Report Download - page 79
Download and view the complete annual report
Please find page 79 of the 2013 United Healthcare annual report below. You can navigate through the pages in the report by either clicking on the pages listed below, or by using the keyword search tool below to find specific information within the annual report.-
 1
1 -
2
-
3
-
4
-
5
-
6
-
7
-
8
-
9
-
10
-
11
-
12
-
13
-
14
-
15
-
16
-
17
-
18
-
19
-
20
-
21
-
22
-
23
-
24
-
25
-
26
-
27
-
28
-
29
-
30
-
31
-
32
-
33
-
34
-
35
-
36
-
37
-
38
-
39
-
40
-
41
-
42
-
43
-
44
-
45
-
46
-
47
-
48
-
49
-
50
-
51
-
52
-
53
-
54
-
55
-
56
-
57
-
58
-
59
-
60
-
61
-
62
-
63
-
64
-
65
-
66
-
67
-
68
-
 69
69 -
 70
70 -
 71
71 -
 72
72 -
 73
73 -
 74
74 -
 75
75 -
 76
76 -
 77
77 -
 78
78 -
 79
79 -
 80
80 -
 81
81 -
 82
82 -
 83
83 -
 84
84 -
 85
85 -
 86
86 -
 87
87 -
 88
88 -
 89
89 -
90
-
91
-
92
-
93
-
94
-
95
-
96
-
97
-
98
-
99
-
100
-
101
-
102
-
103
-
104
-
105
-
106
-
107
-
108
-
109
-
110
-
111
-
112
-
113
-
114
-
115
-
116
-
117
-
118
-
119
-
120
 |
 |

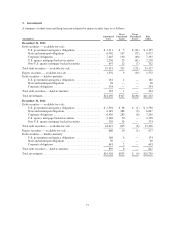
3. Investments
A summary of short-term and long-term investments by major security type is as follows:
(in millions)
Amortized
Cost
Gross
Unrealized
Gains
Gross
Unrealized
Losses
Fair
Value
December 31, 2013
Debt securities — available-for-sale:
U.S. government and agency obligations ................. $ 2,211 $ 5 $ (21) $ 2,195
State and municipal obligations ......................... 6,902 147 (72) 6,977
Corporate obligations ................................. 7,265 130 (60) 7,335
U.S. agency mortgage-backed securities .................. 2,256 23 (61) 2,218
Non-U.S. agency mortgage-backed securities .............. 697 12 (7) 702
Total debt securities — available-for-sale ..................... 19,331 317 (221) 19,427
Equity securities — available-for-sale ........................ 1,576 9 (13) 1,572
Debt securities — held-to-maturity:
U.S. government and agency obligations ................. 181 1 — 182
State and municipal obligations ......................... 28 — — 28
Corporate obligations ................................. 334 — — 334
Total debt securities — held-to-maturity ...................... 543 1 — 544
Total investments ........................................ $21,450 $327 $(234) $21,543
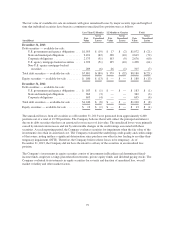
December 31, 2012
Debt securities — available-for-sale:
U.S. government and agency obligations ................. $ 2,501 $ 38 $ (1) $ 2,538
State and municipal obligations ......................... 6,282 388 (3) 6,667
Corporate obligations ................................. 6,930 283 (4) 7,209
U.S. agency mortgage-backed securities .................. 2,168 70 — 2,238
Non-U.S. agency mortgage-backed securities .............. 538 36 — 574
Total debt securities — available-for-sale ..................... 18,419 815 (8) 19,226
Equity securities — available-for-sale ........................ 668 10 (1) 677
Debt securities — held-to-maturity:
U.S. government and agency obligations ................. 168 6 — 174
State and municipal obligations ......................... 30 — — 30
Corporate obligations ................................. 641 2 — 643
Total debt securities — held-to-maturity ...................... 839 8 — 847
Total investments ........................................ $19,926 $833 $ (9) $20,750
77