United Healthcare 2012 Annual Report Download - page 84
Download and view the complete annual report
Please find page 84 of the 2012 United Healthcare annual report below. You can navigate through the pages in the report by either clicking on the pages listed below, or by using the keyword search tool below to find specific information within the annual report.-
 1
1 -
2
-
3
-
4
-
5
-
6
-
7
-
8
-
9
-
10
-
11
-
12
-
13
-
14
-
15
-
16
-
17
-
18
-
19
-
20
-
21
-
22
-
23
-
24
-
25
-
26
-
27
-
28
-
29
-
30
-
31
-
32
-
33
-
34
-
35
-
36
-
37
-
38
-
39
-
40
-
41
-
42
-
43
-
44
-
45
-
46
-
47
-
48
-
49
-
50
-
51
-
52
-
53
-
54
-
55
-
56
-
57
-
58
-
59
-
60
-
61
-
62
-
63
-
64
-
65
-
66
-
67
-
68
-
69
-
70
-
71
-
72
-
73
-
 74
74 -
 75
75 -
 76
76 -
 77
77 -
 78
78 -
 79
79 -
 80
80 -
 81
81 -
 82
82 -
 83
83 -
 84
84 -
 85
85 -
 86
86 -
 87
87 -
 88
88 -
 89
89 -
 90
90 -
 91
91 -
 92
92 -
 93
93 -
 94
94 -
95
-
96
-
97
-
98
-
99
-
100
-
101
-
102
-
103
-
104
-
105
-
106
-
107
-
108
-
109
-
110
-
111
-
112
-
113
-
114
-
115
-
116
-
117
-
118
-
119
-
120
-
121
-
122
-
123
-
124
-
125
-
126
-
127
-
128
 |
 |

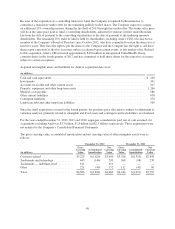
The fair values of the Company’s mortgage-backed securities by credit rating (when multiple credit ratings are
available for an individual security, the average of the available ratings is used) and origination as of
December 31, 2012 were as follows:
(in millions) AAA AA A
Non-Investment
Grade
Total Fair
Value
2012 ............................................ $ 123 $ — $ — $ — $ 123
2011 ............................................ 27 — — — 27
2010 ............................................ — 3 — — 3
2007 ............................................ 88 — — 2 90
2006 ............................................ 137 — 11 8 156
Pre-2006 ......................................... 167 5 — 3 175
U.S. agency mortgage-backed securities ................ 2,238 — — — 2,238
Total ............................................ $2,780$8$11 $13 $2,812
The Company includes in the non-investment grade column in the table above any securities backed by Alt-A or
sub-prime mortgages and any commercial mortgage loans in default.
The amortized cost and fair value of available-for-sale debt securities as of December 31, 2012, by contractual
maturity, were as follows:
(in millions)
Amortized
Cost
Fair
Value
Due in one year or less ....................................................... $ 3,107 $ 3,120
Due after one year through five years ........................................... 6,249 6,471
Due after five years through ten years ........................................... 4,695 5,039
Due after ten years .......................................................... 1,662 1,784
U.S. agency mortgage-backed securities ......................................... 2,168 2,238
Non-U.S. agency mortgage-backed securities ..................................... 538 574
Total debt securities — available-for-sale ........................................ $18,419 $19,226
The amortized cost and fair value of held-to-maturity debt securities as of December 31, 2012, by contractual
maturity, were as follows:
(in millions)
Amortized
Cost
Fair
Value
Due in one year or less ......................................................... $435 $436
Due after one year through five years ............................................. 126 129
Due after five years through ten years ............................................. 177 180
Due after ten years ............................................................ 101 102
Total debt securities — held-to-maturity ........................................... $839 $847
82