United Healthcare 2012 Annual Report Download - page 106
Download and view the complete annual report
Please find page 106 of the 2012 United Healthcare annual report below. You can navigate through the pages in the report by either clicking on the pages listed below, or by using the keyword search tool below to find specific information within the annual report.-
 1
1 -
2
-
3
-
4
-
5
-
6
-
7
-
8
-
9
-
10
-
11
-
12
-
13
-
14
-
15
-
16
-
17
-
18
-
19
-
20
-
21
-
22
-
23
-
24
-
25
-
26
-
27
-
28
-
29
-
30
-
31
-
32
-
33
-
34
-
35
-
36
-
37
-
38
-
39
-
40
-
41
-
42
-
43
-
44
-
45
-
46
-
47
-
48
-
49
-
50
-
51
-
52
-
53
-
54
-
55
-
56
-
57
-
58
-
59
-
60
-
61
-
62
-
63
-
64
-
65
-
66
-
67
-
68
-
69
-
70
-
71
-
72
-
73
-
74
-
75
-
76
-
77
-
78
-
79
-
80
-
81
-
82
-
83
-
84
-
85
-
86
-
87
-
88
-
89
-
90
-
91
-
92
-
93
-
94
-
95
-
 96
96 -
 97
97 -
 98
98 -
 99
99 -
 100
100 -
 101
101 -
 102
102 -
 103
103 -
 104
104 -
 105
105 -
 106
106 -
 107
107 -
 108
108 -
 109
109 -
 110
110 -
 111
111 -
 112
112 -
 113
113 -
 114
114 -
 115
115 -
 116
116 -
117
-
118
-
119
-
120
-
121
-
122
-
123
-
124
-
125
-
126
-
127
-
128
 |
 |

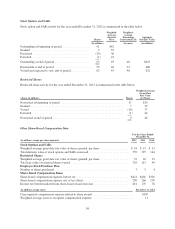
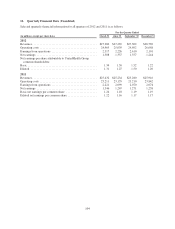
14. Quarterly Financial Data (Unaudited)
Selected quarterly financial information for all quarters of 2012 and 2011 is as follows:
For the Quarter Ended
(in millions, except per share data) March 31 June 30 September 30 December 31
2012
Revenues ............................................ $27,282 $27,265 $27,302 $28,769
Operating costs ....................................... 24,965 25,039 24,692 26,668
Earnings from operations ............................... 2,317 2,226 2,610 2,101
Net earnings ......................................... 1,388 1,337 1,557 1,244
Net earnings per share attributable to UnitedHealth Group
common shareholders:
Basic ............................................... 1.34 1.30 1.52 1.22
Diluted ............................................. 1.31 1.27 1.50 1.20
2011
Revenues ............................................ $25,432 $25,234 $25,280 $25,916
Operating costs ....................................... 23,211 23,135 23,210 23,842
Earnings from operations ............................... 2,221 2,099 2,070 2,074
Net earnings ......................................... 1,346 1,267 1,271 1,258
Basic net earnings per common share ..................... 1.24 1.18 1.19 1.19
Diluted net earnings per common share .................... 1.22 1.16 1.17 1.17
104