United Healthcare 2012 Annual Report Download - page 66
Download and view the complete annual report
Please find page 66 of the 2012 United Healthcare annual report below. You can navigate through the pages in the report by either clicking on the pages listed below, or by using the keyword search tool below to find specific information within the annual report.-
 1
1 -
2
-
3
-
4
-
5
-
6
-
7
-
8
-
9
-
10
-
11
-
12
-
13
-
14
-
15
-
16
-
17
-
18
-
19
-
20
-
21
-
22
-
23
-
24
-
25
-
26
-
27
-
28
-
29
-
30
-
31
-
32
-
33
-
34
-
35
-
36
-
37
-
38
-
39
-
40
-
41
-
42
-
43
-
44
-
45
-
46
-
47
-
48
-
49
-
50
-
51
-
52
-
53
-
54
-
55
-
 56
56 -
 57
57 -
 58
58 -
 59
59 -
 60
60 -
 61
61 -
 62
62 -
 63
63 -
 64
64 -
 65
65 -
 66
66 -
 67
67 -
 68
68 -
 69
69 -
 70
70 -
 71
71 -
 72
72 -
 73
73 -
 74
74 -
 75
75 -
 76
76 -
77
-
78
-
79
-
80
-
81
-
82
-
83
-
84
-
85
-
86
-
87
-
88
-
89
-
90
-
91
-
92
-
93
-
94
-
95
-
96
-
97
-
98
-
99
-
100
-
101
-
102
-
103
-
104
-
105
-
106
-
107
-
108
-
109
-
110
-
111
-
112
-
113
-
114
-
115
-
116
-
117
-
118
-
119
-
120
-
121
-
122
-
123
-
124
-
125
-
126
-
127
-
128
 |
 |

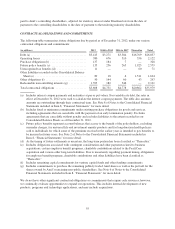
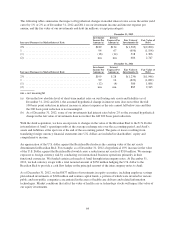
The following tables summarize the impact of hypothetical changes in market interest rates across the entire yield
curve by 1% or 2% as of December 31, 2012 and 2011 on our investment income and interest expense per
annum, and the fair value of our investments and debt (in millions, except percentages):
December 31, 2012
Increase (Decrease) in Market Interest Rate
Investment
Income Per
Annum (a)
Interest
Expense Per
Annum (a)
Fair Value of
Investments (b)
Fair Value of
Debt
2% ............................................ $189 $134 $(1,303) $(2,200)
1.............................................. 94 67 (656) (1,194)
(1) ............................................ (18) (14) 518 1,366
(2) ............................................ nm nm 686 2,747
December 31, 2011
Increase (Decrease) in Market Interest Rate
Investment
Income Per
Annum (a)
Interest
Expense Per
Annum (a)
Fair Value of
Investments (b)
Fair Value of
Debt
2% ............................................ $199 $ 28 $(1,239) $(1,946)
1.............................................. 99 14 (622) (1,082)
(1) ............................................ (12) (4) 586 1,086
(2) ............................................ nm nm 885 2,343
nm = not meaningful
(a) Given the low absolute level of short-term market rates on our floating-rate assets and liabilities as of
December 31, 2012 and 2011, the assumed hypothetical change in interest rates does not reflect the full
100 basis point reduction in interest income or interest expense as the rate cannot fall below zero and thus
the 200 basis point reduction is not meaningful.
(b) As of December 31, 2012, some of our investments had interest rates below 2% so the assumed hypothetical
change in the fair value of investments does not reflect the full 200 basis point reduction.
With the Amil acquisition, we have an exposure to changes in the value of the Brazilian Real to the U.S. Dollar
in translation of Amil’s operating results at the average exchange rate over the accounting period, and Amil’s
assets and liabilities at the spot rate at the end of the accounting period. The gains or losses resulting from
translating foreign currency financial statements into U.S. dollars are included in shareholders’ equity and
comprehensive income.
An appreciation of the U.S. dollar against the Brazilian Real reduces the carrying value of the net assets
denominated in Brazilian Real. For example, as of December 31, 2012 a hypothetical 10% increase in the value
of the U.S. Dollar against the Brazilian Real would cause a reduction in net assets of $510 million. We manage
exposure to foreign currency risk by conducting our international business operations primarily in their
functional currencies. We funded certain cash needs of Amil through intercompany notes. At December 31,
2012, we had currency swaps with a total notional amount of $256 million hedging the U.S. dollar to the
Brazilian Real to provide a cash flow hedge on the principal amount of the intercompany notes to Amil.
As of December 31, 2012, we had $677 million of investments in equity securities, including employee savings
plan related investments of $348 million and venture capital funds, a portion of which were invested in various
public and non-public companies concentrated in the areas of health care delivery and related information
technologies. Market conditions that affect the value of health care or technology stocks will impact the value of
our equity investments.
64