United Healthcare 2012 Annual Report Download - page 38
Download and view the complete annual report
Please find page 38 of the 2012 United Healthcare annual report below. You can navigate through the pages in the report by either clicking on the pages listed below, or by using the keyword search tool below to find specific information within the annual report.-
 1
1 -
2
-
3
-
4
-
5
-
6
-
7
-
8
-
9
-
10
-
11
-
12
-
13
-
14
-
15
-
16
-
17
-
18
-
19
-
20
-
21
-
22
-
23
-
24
-
25
-
26
-
27
-
 28
28 -
 29
29 -
 30
30 -
 31
31 -
 32
32 -
 33
33 -
 34
34 -
 35
35 -
 36
36 -
 37
37 -
 38
38 -
 39
39 -
 40
40 -
 41
41 -
 42
42 -
 43
43 -
 44
44 -
 45
45 -
 46
46 -
 47
47 -
 48
48 -
49
-
50
-
51
-
52
-
53
-
54
-
55
-
56
-
57
-
58
-
59
-
60
-
61
-
62
-
63
-
64
-
65
-
66
-
67
-
68
-
69
-
70
-
71
-
72
-
73
-
74
-
75
-
76
-
77
-
78
-
79
-
80
-
81
-
82
-
83
-
84
-
85
-
86
-
87
-
88
-
89
-
90
-
91
-
92
-
93
-
94
-
95
-
96
-
97
-
98
-
99
-
100
-
101
-
102
-
103
-
104
-
105
-
106
-
107
-
108
-
109
-
110
-
111
-
112
-
113
-
114
-
115
-
116
-
117
-
118
-
119
-
120
-
121
-
122
-
123
-
124
-
125
-
126
-
127
-
128
 |
 |
UNREGISTERED SALE OF EQUITY SECURITIES
On November 2, 2012, we issued and sold, in reliance on Section 4(a)(2) of the Securities Act of 1933, as
amended, 8 million shares of our common stock to CSHG 1122 FUNDO DE INVESTIMENTO
MULTIMERCADO — CRÉDITO PRIVADO INVESTIMENTO NO EXTERIOR, a fund wholly beneficially
owned by Dr. Edson de Godoy Bueno, a member of our Board of Directors. We received net proceeds of
approximately $470 million in cash and did not pay underwriting or placement discounts or fees in the
transaction. Dr. Bueno has agreed to hold the shares for five years from the date of sale, subject to certain
exceptions.
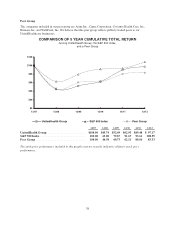
PERFORMANCE GRAPHS
The following two performance graphs compare our total return to shareholders with the returns of indexes of
other specified companies and the S&P 500 Index. The first graph compares the cumulative five-year total return
to shareholders on our common stock relative to the cumulative total returns of the S&P 500 index and a
customized peer group of certain Fortune 50 companies (the “Fortune 50 Group”), for the five-year period ended
December 31, 2012. The second graph compares our cumulative total return to shareholders with the S&P 500
Index and an index of a group of peer companies selected by us for the five-year period ended December 31,
2012. We are not included in either the Fortune 50 Group index in the first graph or the peer group index in the
second graph. In calculating the cumulative total shareholder return of the indexes, the shareholder returns of the
Fortune 50 Group companies in the first graph and the peer group companies in the second graph are weighted
according to the stock market capitalizations of the companies at January 1 of each year. The comparisons
assume the investment of $100 on December 31, 2007 in our common stock and in each index, and that
dividends were reinvested when paid.
36