United Healthcare 2012 Annual Report Download - page 47
Download and view the complete annual report
Please find page 47 of the 2012 United Healthcare annual report below. You can navigate through the pages in the report by either clicking on the pages listed below, or by using the keyword search tool below to find specific information within the annual report.-
 1
1 -
2
-
3
-
4
-
5
-
6
-
7
-
8
-
9
-
10
-
11
-
12
-
13
-
14
-
15
-
16
-
17
-
18
-
19
-
20
-
21
-
22
-
23
-
24
-
25
-
26
-
27
-
28
-
29
-
30
-
31
-
32
-
33
-
34
-
35
-
36
-
 37
37 -
 38
38 -
 39
39 -
 40
40 -
 41
41 -
 42
42 -
 43
43 -
 44
44 -
 45
45 -
 46
46 -
 47
47 -
 48
48 -
 49
49 -
 50
50 -
 51
51 -
 52
52 -
 53
53 -
 54
54 -
 55
55 -
 56
56 -
 57
57 -
58
-
59
-
60
-
61
-
62
-
63
-
64
-
65
-
66
-
67
-
68
-
69
-
70
-
71
-
72
-
73
-
74
-
75
-
76
-
77
-
78
-
79
-
80
-
81
-
82
-
83
-
84
-
85
-
86
-
87
-
88
-
89
-
90
-
91
-
92
-
93
-
94
-
95
-
96
-
97
-
98
-
99
-
100
-
101
-
102
-
103
-
104
-
105
-
106
-
107
-
108
-
109
-
110
-
111
-
112
-
113
-
114
-
115
-
116
-
117
-
118
-
119
-
120
-
121
-
122
-
123
-
124
-
125
-
126
-
127
-
128
 |
 |

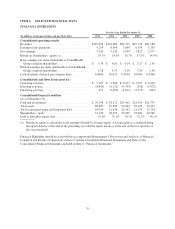
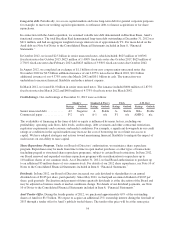
RESULTS SUMMARY
(in millions, except percentages and per share data)
For the Years Ended December 31,
Increase/
(Decrease)
Increase/
(Decrease)
2012 2011 2010 2012 vs. 2011 2011 vs. 2010
Revenues:
Premiums ............................. $ 99,728 $ 91,983 $85,405 $7,745 8% $6,578 8%
Services .............................. 7,437 6,613 5,819 824 12 794 14
Products .............................. 2,773 2,612 2,322 161 6 290 12
Investment and other income .............. 680 654 609 26 4 45 7
Total revenues ........................... 110,618 101,862 94,155 8,756 9 7,707 8
Operating costs:
Medical costs .......................... 80,226 74,332 68,841 5,894 8 5,491 8
Operating costs ........................ 17,306 15,557 14,270 1,749 11 1,287 9
Cost of products sold .................... 2,523 2,385 2,116 138 6 269 13
Depreciation and amortization ............. 1,309 1,124 1,064 185 16 60 6
Total operating costs ...................... 101,364 93,398 86,291 7,966 9 7,107 8
Earnings from operations ................... 9,254 8,464 7,864 790 9 600 8
Interest expense ........................ (632) (505) (481) 127 25 24 5
Earnings before income taxes ............... 8,622 7,959 7,383 663 8 576 8
Provision for income taxes ................. (3,096) (2,817) (2,749) 279 10 68 2
Net earnings ............................. $ 5,526 $ 5,142 $ 4,634 $ 384 7% $ 508 11%
Diluted earnings per share attributable to
UnitedHealth Group common shareholders . . $ 5.28 $ 4.73 $ 4.10 $ 0.55 12% $ 0.63 15%
Medical care ratio (a) ...................... 80.4% 80.8% 80.6% (0.4)% 0.2%
Operating cost ratio ....................... 15.6 15.3 15.2 0.3 0.1
Operating margin ......................... 8.4 8.3 8.4 0.1 (0.1)
Tax rate ................................ 35.9 35.4 37.2 0.5 (1.8)
Net margin .............................. 5.0 5.0 4.9 — 0.1
Return on equity (b) ....................... 18.7% 18.9% 18.7% (0.2)% 0.2%
(a) Medical care ratio is calculated as medical costs divided by premium revenue.
(b) Return on equity is calculated as net earnings divided by average equity. Average equity is calculated using
the equity balance at the end of the preceding year and the equity balances at the end of the four quarters of
the year presented.
SELECTED OPERATING PERFORMANCE AND OTHER SIGNIFICANT ITEMS
The following represents a summary of select 2012 year-over-year operating comparisons to 2011 and other 2012
significant items.
• Consolidated revenues increased 9% and UnitedHealthcare revenues increased 8%.
• UnitedHealthcare medical enrollment grew by 6.4 million people, including 4.4 million people served in
Brazil as a result of the Amil acquisition; Medicare Part D stand-alone membership decreased by 0.6 million
people.
• The consolidated medical care ratio of 80.4% decreased 40 basis points.
• Earnings from operations increased 8% at UnitedHealthcare and 14% at Optum.
• Net earnings of $5.5 billion and diluted earnings per share of $5.28 increased 7% and 12%, respectively.
45