United Healthcare 2012 Annual Report Download - page 41
Download and view the complete annual report
Please find page 41 of the 2012 United Healthcare annual report below. You can navigate through the pages in the report by either clicking on the pages listed below, or by using the keyword search tool below to find specific information within the annual report.-
 1
1 -
2
-
3
-
4
-
5
-
6
-
7
-
8
-
9
-
10
-
11
-
12
-
13
-
14
-
15
-
16
-
17
-
18
-
19
-
20
-
21
-
22
-
23
-
24
-
25
-
26
-
27
-
28
-
29
-
30
-
 31
31 -
 32
32 -
 33
33 -
 34
34 -
 35
35 -
 36
36 -
 37
37 -
 38
38 -
 39
39 -
 40
40 -
 41
41 -
 42
42 -
 43
43 -
 44
44 -
 45
45 -
 46
46 -
 47
47 -
 48
48 -
 49
49 -
 50
50 -
 51
51 -
52
-
53
-
54
-
55
-
56
-
57
-
58
-
59
-
60
-
61
-
62
-
63
-
64
-
65
-
66
-
67
-
68
-
69
-
70
-
71
-
72
-
73
-
74
-
75
-
76
-
77
-
78
-
79
-
80
-
81
-
82
-
83
-
84
-
85
-
86
-
87
-
88
-
89
-
90
-
91
-
92
-
93
-
94
-
95
-
96
-
97
-
98
-
99
-
100
-
101
-
102
-
103
-
104
-
105
-
106
-
107
-
108
-
109
-
110
-
111
-
112
-
113
-
114
-
115
-
116
-
117
-
118
-
119
-
120
-
121
-
122
-
123
-
124
-
125
-
126
-
127
-
128
 |
 |

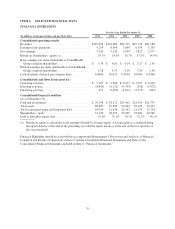
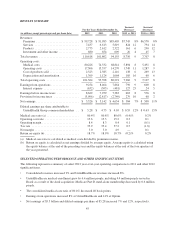
ITEM 6. SELECTED FINANCIAL DATA
FINANCIAL HIGHLIGHTS
For the Year Ended December 31,
(In millions, except percentages and per share data) 2012 2011 2010 2009 2008
Consolidated operating results
Revenues ...................................... $110,618 $101,862 $94,155 $87,138 $81,186
Earnings from operations .......................... 9,254 8,464 7,864 6,359 5,263
Net earnings .................................... 5,526 5,142 4,634 3,822 2,977
Return on shareholders’ equity (a) ................... 18.7% 18.9% 18.7% 17.3% 14.9%
Basic earnings per share attributable to UnitedHealth
Group common shareholders ..................... $ 5.38 $ 4.81 $ 4.14 $ 3.27 $ 2.45
Diluted earnings per share attributable to UnitedHealth
Group common shareholders ..................... 5.28 4.73 4.10 3.24 2.40
Cash dividends declared per common share ........... 0.8000 0.6125 0.4050 0.0300 0.0300
Consolidated cash flows from (used for)
Operating activities .............................. $ 7,155 $ 6,968 $ 6,273 $ 5,625 $ 4,238
Investing activities ............................... (8,649) (4,172) (5,339) (976) (5,072)
Financing activities .............................. 471 (2,490) (1,611) (2,275) (605)
Consolidated financial condition
(As of December 31)
Cash and investments ............................. $ 29,148 $ 28,172 $25,902 $24,350 $21,575
Total assets ..................................... 80,885 67,889 63,063 59,045 55,815
Total commercial paper and long-term debt ........... 16,754 11,638 11,142 11,173 12,794
Shareholders’ equity .............................. 31,178 28,292 25,825 23,606 20,780
Debt to debt-plus-equity ratio ...................... 35.0% 29.1% 30.1% 32.1% 38.1%
(a) Return on equity is calculated as net earnings divided by average equity. Average equity is calculated using
the equity balance at the end of the preceding year and the equity balances at the end of the four quarters of
the year presented.
Financial Highlights should be read with the accompanying Management’s Discussion and Analysis of Financial
Condition and Results of Operations in Item 7 and the Consolidated Financial Statements and Notes to the
Consolidated Financial Statements included in Item 8, “Financial Statements.”
39