United Healthcare 2012 Annual Report Download - page 83
Download and view the complete annual report
Please find page 83 of the 2012 United Healthcare annual report below. You can navigate through the pages in the report by either clicking on the pages listed below, or by using the keyword search tool below to find specific information within the annual report.-
 1
1 -
2
-
3
-
4
-
5
-
6
-
7
-
8
-
9
-
10
-
11
-
12
-
13
-
14
-
15
-
16
-
17
-
18
-
19
-
20
-
21
-
22
-
23
-
24
-
25
-
26
-
27
-
28
-
29
-
30
-
31
-
32
-
33
-
34
-
35
-
36
-
37
-
38
-
39
-
40
-
41
-
42
-
43
-
44
-
45
-
46
-
47
-
48
-
49
-
50
-
51
-
52
-
53
-
54
-
55
-
56
-
57
-
58
-
59
-
60
-
61
-
62
-
63
-
64
-
65
-
66
-
67
-
68
-
69
-
70
-
71
-
72
-
 73
73 -
 74
74 -
 75
75 -
 76
76 -
 77
77 -
 78
78 -
 79
79 -
 80
80 -
 81
81 -
 82
82 -
 83
83 -
 84
84 -
 85
85 -
 86
86 -
 87
87 -
 88
88 -
 89
89 -
 90
90 -
 91
91 -
 92
92 -
 93
93 -
94
-
95
-
96
-
97
-
98
-
99
-
100
-
101
-
102
-
103
-
104
-
105
-
106
-
107
-
108
-
109
-
110
-
111
-
112
-
113
-
114
-
115
-
116
-
117
-
118
-
119
-
120
-
121
-
122
-
123
-
124
-
125
-
126
-
127
-
128
 |
 |

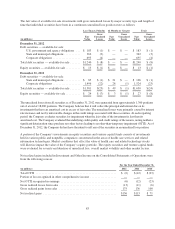
3. Investments
A summary of short-term and long-term investments by major security type is as follows:
(in millions)
Amortized
Cost
Gross
Unrealized
Gains
Gross
Unrealized
Losses
Fair
Value
December 31, 2012
Debt securities — available-for-sale:
U.S. government and agency obligations ................. $ 2,501 $ 38 $ (1) $ 2,538
State and municipal obligations ......................... 6,282 388 (3) 6,667
Corporate obligations ................................. 6,930 283 (4) 7,209
U.S. agency mortgage-backed securities .................. 2,168 70 — 2,238
Non-U.S. agency mortgage-backed securities .............. 538 36 — 574
Total debt securities — available-for-sale ..................... 18,419 815 (8) 19,226
Equity securities — available-for-sale ........................ 668 10 (1) 677
Debt securities — held-to-maturity:
U.S. government and agency obligations ................. 168 6 — 174
State and municipal obligations ......................... 30 — — 30
Corporate obligations ................................. 641 2 — 643
Total debt securities — held-to-maturity ...................... 839 8 — 847
Total investments ........................................ $19,926 $833 $ (9) $20,750
December 31, 2011
Debt securities — available-for-sale:
U.S. government and agency obligations ................. $ 2,319 $ 54 $ — $ 2,373
State and municipal obligations ......................... 6,363 403 (1) 6,765
Corporate obligations ................................. 5,825 205 (23) 6,007
U.S. agency mortgage-backed securities .................. 2,279 74 — 2,353
Non-U.S. agency mortgage-backed securities .............. 476 28 — 504
Total debt securities — available-for-sale ..................... 17,262 764 (24) 18,002
Equity securities — available-for-sale ........................ 529 23 (8) 544
Debt securities — held-to-maturity:
U.S. government and agency obligations ................. 166 7 — 173
State and municipal obligations ......................... 13 — — 13
Corporate obligations ................................. 18 — — 18
Total debt securities — held-to-maturity ...................... 197 7 — 204
Total investments ........................................ $17,988 $794 $(32) $18,750
81