United Healthcare 2012 Annual Report Download - page 53
Download and view the complete annual report
Please find page 53 of the 2012 United Healthcare annual report below. You can navigate through the pages in the report by either clicking on the pages listed below, or by using the keyword search tool below to find specific information within the annual report.-
 1
1 -
2
-
3
-
4
-
5
-
6
-
7
-
8
-
9
-
10
-
11
-
12
-
13
-
14
-
15
-
16
-
17
-
18
-
19
-
20
-
21
-
22
-
23
-
24
-
25
-
26
-
27
-
28
-
29
-
30
-
31
-
32
-
33
-
34
-
35
-
36
-
37
-
38
-
39
-
40
-
41
-
42
-
 43
43 -
 44
44 -
 45
45 -
 46
46 -
 47
47 -
 48
48 -
 49
49 -
 50
50 -
 51
51 -
 52
52 -
 53
53 -
 54
54 -
 55
55 -
 56
56 -
 57
57 -
 58
58 -
 59
59 -
 60
60 -
 61
61 -
 62
62 -
 63
63 -
64
-
65
-
66
-
67
-
68
-
69
-
70
-
71
-
72
-
73
-
74
-
75
-
76
-
77
-
78
-
79
-
80
-
81
-
82
-
83
-
84
-
85
-
86
-
87
-
88
-
89
-
90
-
91
-
92
-
93
-
94
-
95
-
96
-
97
-
98
-
99
-
100
-
101
-
102
-
103
-
104
-
105
-
106
-
107
-
108
-
109
-
110
-
111
-
112
-
113
-
114
-
115
-
116
-
117
-
118
-
119
-
120
-
121
-
122
-
123
-
124
-
125
-
126
-
127
-
128
 |
 |
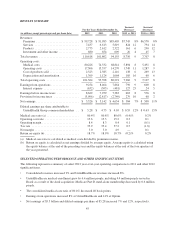
The increases in earnings from operations and operating margins for 2011 reflect an increased mix of higher
margin services in 2011 as well as the effect on 2010 earnings from operations and operating margin of the
goodwill impairment and charges for a business line disposition of certain i3-branded clinical trial service
businesses.
OptumRx
The increase in OptumRx revenues for 2011 was due to increased prescription volumes, primarily due to growth
in customers served through Medicare Part D prescription drug plans by our UnitedHealthcare Medicare &
Retirement business, and a favorable mix of higher revenue specialty drug prescriptions. Intersegment revenues
eliminated in consolidation were $16.7 billion and $14.4 billion for 2011 and 2010, respectively.
OptumRx earnings from operations and operating margins for 2011 decreased as the mix of lower margin
specialty pharmaceuticals and Medicaid business and investments to support growth initiatives including the in-
sourcing of our commercial pharmacy benefit programs more than offset the earnings contribution from higher
revenues and greater use of generic medications.
LIQUIDITY, FINANCIAL CONDITION AND CAPITAL RESOURCES
Liquidity
Introduction
We manage our liquidity and financial position in the context of our overall business strategy. We continually
forecast and manage our cash, investments, working capital balances and capital structure to meet the short- and
long-term obligations of our businesses while seeking to maintain liquidity and financial flexibility. Cash flows
generated from operating activities are principally from earnings before non-cash expenses.
Our regulated subsidiaries generate significant cash flows from operations and are subject to financial regulations
and standards in their respective jurisdictions. These standards, among other things, require these subsidiaries to
maintain specified levels of statutory capital, as defined by each jurisdiction, and restrict the timing and amount
of dividends and other distributions that may be paid to their parent companies. In the United States, most of
these regulations and standards are generally consistent with model regulations established by the NAIC. Except
in the case of extraordinary dividends, these standards generally permit dividends to be paid from statutory
unassigned surplus of the regulated subsidiary and are limited based on the regulated subsidiary’s level of
statutory net income and statutory capital and surplus. These dividends are referred to as “ordinary dividends”
and generally can be paid without prior regulatory approval. If the dividend, together with other dividends paid
within the preceding twelve months, exceeds a specified statutory limit or is paid from sources other than earned
surplus, the entire dividend is generally considered an “extraordinary dividend” and must receive prior regulatory
approval. In 2012, based on the 2011 statutory net income and statutory capital and surplus levels, the maximum
amount of ordinary dividends which could be paid by our U.S. regulated subsidiaries to their parent companies
was $4.6 billion.
In 2012, our regulated subsidiaries paid their parent companies dividends of $4.9 billion, including $1.2 billion of
extraordinary dividends. In 2011, our regulated subsidiaries paid their parent companies dividends of
$4.5 billion, including $1.1 billion of extraordinary dividends.
Our non-regulated businesses also generate cash flows from operations for general corporate use. Cash flows
generated by these entities, combined with dividends from our regulated entities and financing through the
issuance of long term debt as well as issuance of commercial paper or drawings under our committed credit
facility, further strengthen our operating and financial flexibility. We use these cash flows to expand our
businesses through acquisitions, reinvest in our businesses through capital expenditures, repay debt, and return
capital to our shareholders through shareholder dividends and/or repurchases of our common stock, depending on
market conditions.
51