United Healthcare 2009 Annual Report Download - page 95
Download and view the complete annual report
Please find page 95 of the 2009 United Healthcare annual report below. You can navigate through the pages in the report by either clicking on the pages listed below, or by using the keyword search tool below to find specific information within the annual report.-
 1
1 -
2
-
3
-
4
-
5
-
6
-
7
-
8
-
9
-
10
-
11
-
12
-
13
-
14
-
15
-
16
-
17
-
18
-
19
-
20
-
21
-
22
-
23
-
24
-
25
-
26
-
27
-
28
-
29
-
30
-
31
-
32
-
33
-
34
-
35
-
36
-
37
-
38
-
39
-
40
-
41
-
42
-
43
-
44
-
45
-
46
-
47
-
48
-
49
-
50
-
51
-
52
-
53
-
54
-
55
-
56
-
57
-
58
-
59
-
60
-
61
-
62
-
63
-
64
-
65
-
66
-
67
-
68
-
69
-
70
-
71
-
72
-
73
-
74
-
75
-
76
-
77
-
78
-
79
-
80
-
81
-
82
-
83
-
84
-
 85
85 -
 86
86 -
 87
87 -
 88
88 -
 89
89 -
 90
90 -
 91
91 -
 92
92 -
 93
93 -
 94
94 -
 95
95 -
 96
96 -
 97
97 -
 98
98 -
 99
99 -
 100
100 -
 101
101 -
 102
102 -
 103
103 -
 104
104 -
 105
105 -
106
-
107
-
108
-
109
-
110
-
111
-
112
-
113
-
114
-
115
-
116
-
117
-
118
-
119
-
120
-
121
-
122
-
123
-
124
-
125
-
126
-
127
-
128
-
129
-
130
-
131
-
132
-
133
-
134
-
135
-
136
-
137
 |
 |

UNITEDHEALTH GROUP
NOTES TO THE CONSOLIDATED FINANCIAL STATEMENTS—(Continued)
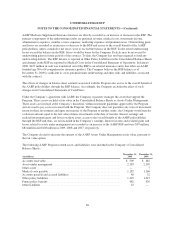
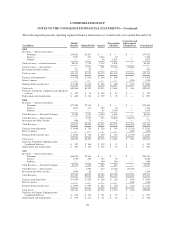
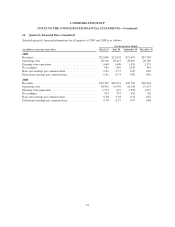
16. Quarterly Financial Data (Unaudited)
Selected quarterly financial information for all quarters of 2009 and 2008 is as follows:
For the Quarter Ended
(in millions, except per share data) March 31 June 30 September 30 December 31
2009
Revenues ............................................ $22,004 $21,655 $21,695 $21,784
Operating costs ....................................... 20,336 20,215 20,019 20,209
Earnings from operations ............................... 1,668 1,440 1,676 1,575
Net earnings ......................................... 984 859 1,035 944
Basic net earnings per common share ..................... 0.82 0.73 0.90 0.82
Diluted net earnings per common share .................... 0.81 0.73 0.89 0.81
2008
Revenues ............................................ $20,304 $20,272 $20,156 $20,454
Operating costs ....................................... 18,591 19,599 18,558 19,175
Earnings from operations ............................... 1,713 673 1,598 1,279
Net earnings ......................................... 994 337 920 726
Basic net earnings per common share ..................... 0.80 0.28 0.76 0.61
Diluted net earnings per common share .................... 0.78 0.27 0.75 0.60
93