United Healthcare 2009 Annual Report Download - page 39
Download and view the complete annual report
Please find page 39 of the 2009 United Healthcare annual report below. You can navigate through the pages in the report by either clicking on the pages listed below, or by using the keyword search tool below to find specific information within the annual report.-
 1
1 -
2
-
3
-
4
-
5
-
6
-
7
-
8
-
9
-
10
-
11
-
12
-
13
-
14
-
15
-
16
-
17
-
18
-
19
-
20
-
21
-
22
-
23
-
24
-
25
-
26
-
27
-
28
-
 29
29 -
 30
30 -
 31
31 -
 32
32 -
 33
33 -
 34
34 -
 35
35 -
 36
36 -
 37
37 -
 38
38 -
 39
39 -
 40
40 -
 41
41 -
 42
42 -
 43
43 -
 44
44 -
 45
45 -
 46
46 -
 47
47 -
 48
48 -
 49
49 -
50
-
51
-
52
-
53
-
54
-
55
-
56
-
57
-
58
-
59
-
60
-
61
-
62
-
63
-
64
-
65
-
66
-
67
-
68
-
69
-
70
-
71
-
72
-
73
-
74
-
75
-
76
-
77
-
78
-
79
-
80
-
81
-
82
-
83
-
84
-
85
-
86
-
87
-
88
-
89
-
90
-
91
-
92
-
93
-
94
-
95
-
96
-
97
-
98
-
99
-
100
-
101
-
102
-
103
-
104
-
105
-
106
-
107
-
108
-
109
-
110
-
111
-
112
-
113
-
114
-
115
-
116
-
117
-
118
-
119
-
120
-
121
-
122
-
123
-
124
-
125
-
126
-
127
-
128
-
129
-
130
-
131
-
132
-
133
-
134
-
135
-
136
-
137
 |
 |

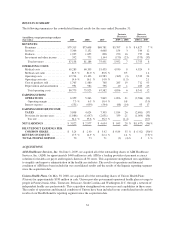
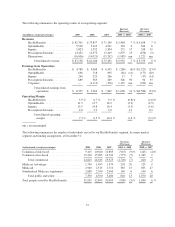
The following summarizes the operating results of our reporting segments:
Increase
(Decrease)
Increase
(Decrease)
(in millions, except percentages) 2009 2008 2007 2009 vs. 2008 2008 vs. 2007
Revenues
Health Benefits ................ $81,341 $ 75,857 $ 71,199 $ 5,484 7 % $ 4,658 7 %
OptumHealth .................. 5,528 5,225 4,921 303 6 304 6
Ingenix ...................... 1,823 1,552 1,304 271 17 248 19
Prescription Solutions ........... 14,452 12,573 13,249 1,879 15 (676) (5)
Eliminations .................. (16,006) (14,021) (15,242) (1,985) nm 1,221 nm
Consolidated revenues ...... $87,138 $ 81,186 $ 75,431 $ 5,952 7 % $ 5,755 8 %
Earnings from Operations
Health Benefits ................ $ 4,788 $ 5,068 $ 6,595 $ (280) (6)% $(1,527) (23)%
OptumHealth .................. 636 718 895 (82) (11) (177) (20)
Ingenix ...................... 246 229 266 17 7 (37) (14)
Prescription Solutions ........... 689 363 269 326 90 94 35
Corporate ..................... — (1,115) (176) 1,115 nm (939) nm
Consolidated earnings from
operations .............. $ 6,359 $ 5,263 $ 7,849 $ 1,096 21 % $(2,586) (33)%
Operating Margin
Health Benefits ................ 5.9% 6.7% 9.3% (0.8)% (2.6)%
OptumHealth .................. 11.5 13.7 18.2 (2.2) (4.5)
Ingenix ...................... 13.5 14.8 20.4 (1.3) (5.6)
Prescription Solutions ........... 4.8 2.9 2.0 1.9 0.9
Consolidated operating
margin ................. 7.3% 6.5% 10.4 % 0.8 % (3.9)%
nm = not meaningful
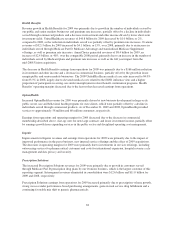
The following summarizes the number of individuals served by our Health Benefits segment, by major market
segment and funding arrangement, at December 31:
Increase
(Decrease)
Increase
(Decrease)
(in thousands, except percentages) 2009 2008 2007 2009 vs. 2008 2008 vs. 2007
Commercial risk-based ...................... 9,415 10,360 10,805 (945) (9)% (445) (4)%
Commercial fee-based ...................... 15,210 15,985 14,720 (775) (5) 1,265 9
Total commercial ...................... 24,625 26,345 25,525 (1,720) (7) 820 3
Medicare Advantage ........................ 1,790 1,495 1,370 295 20 125 9
Medicaid ................................. 2,900 2,515 1,710 385 15 805 47
Standardized Medicare supplement ............ 2,680 2,540 2,400 140 6 140 6
Total public and senior .................. 7,370 6,550 5,480 820 13 1,070 20
Total people served by Health Benefits ......... 31,995 32,895 31,005 (900) (3)% 1,890 6 %
37