United Healthcare 2009 Annual Report Download - page 89
Download and view the complete annual report
Please find page 89 of the 2009 United Healthcare annual report below. You can navigate through the pages in the report by either clicking on the pages listed below, or by using the keyword search tool below to find specific information within the annual report.-
 1
1 -
2
-
3
-
4
-
5
-
6
-
7
-
8
-
9
-
10
-
11
-
12
-
13
-
14
-
15
-
16
-
17
-
18
-
19
-
20
-
21
-
22
-
23
-
24
-
25
-
26
-
27
-
28
-
29
-
30
-
31
-
32
-
33
-
34
-
35
-
36
-
37
-
38
-
39
-
40
-
41
-
42
-
43
-
44
-
45
-
46
-
47
-
48
-
49
-
50
-
51
-
52
-
53
-
54
-
55
-
56
-
57
-
58
-
59
-
60
-
61
-
62
-
63
-
64
-
65
-
66
-
67
-
68
-
69
-
70
-
71
-
72
-
73
-
74
-
75
-
76
-
77
-
78
-
 79
79 -
 80
80 -
 81
81 -
 82
82 -
 83
83 -
 84
84 -
 85
85 -
 86
86 -
 87
87 -
 88
88 -
 89
89 -
 90
90 -
 91
91 -
 92
92 -
 93
93 -
 94
94 -
 95
95 -
 96
96 -
 97
97 -
 98
98 -
 99
99 -
100
-
101
-
102
-
103
-
104
-
105
-
106
-
107
-
108
-
109
-
110
-
111
-
112
-
113
-
114
-
115
-
116
-
117
-
118
-
119
-
120
-
121
-
122
-
123
-
124
-
125
-
126
-
127
-
128
-
129
-
130
-
131
-
132
-
133
-
134
-
135
-
136
-
137
 |
 |

UNITEDHEALTH GROUP
NOTES TO THE CONSOLIDATED FINANCIAL STATEMENTS—(Continued)
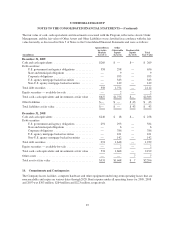
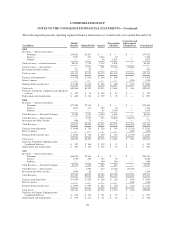
The fair value of cash, cash equivalents and investments associated with the Program, reflected as Assets Under
Management, and the fair value of Other Assets and Other Liabilities were classified in accordance with the fair
value hierarchy as discussed in Note 5 of Notes to the Consolidated Financial Statements and were as follows:
(in millions)
Quoted Prices
in Active
Markets
(Level 1)
Other
Observable
Inputs
(Level 2)
Unobservable
Inputs
(Level 3)
Total
Fair Value
December 31, 2009
Cash and cash equivalents ........................... $269 $ — $— $ 269
Debt securities:
U.S. government and agency obligations ............ 358 298 — 656
State and municipal obligations ................... — 9 — 9
Corporate obligations ........................... — 955 — 955
U.S. agency mortgage-backed securities ............ — 343 — 343
Non-U.S. agency mortgage-backed securities ........ — 149 — 149
Total debt securities ................................ 358 1,754 — 2,112
Equity securities — available-for-sale .................. — 2 — 2
Total cash, cash equivalents and investments at fair value . . $627 $1,756 $— $2,383
Other liabilities .................................... $— $ — $ 43 $ 43
Total liabilities at fair value .......................... $— $ — $ 43 $ 43
December 31, 2008
Cash and cash equivalents ........................... $240 $ 18 $— $ 258
Debt securities:
U.S. government and agency obligations ............ 291 293 — 584
State and municipal obligations ................... — 6 — 6
Corporate obligations ........................... — 786 — 786
U.S. agency mortgage-backed securities ............ — 421 — 421
Non-U.S. agency mortgage-backed securities ........ — 142 — 142
Total debt securities ................................ 291 1,648 — 1,939
Equity securities — available-for-sale .................. — 2 — 2
Total cash, cash equivalents and investments at fair value . . 531 1,668 — 2,199
Other assets ....................................... — — 7 7
Total assets at fair value ............................. $531 $1,668 $ 7 $2,206
14. Commitments and Contingencies
The Company leases facilities, computer hardware and other equipment under long-term operating leases that are
noncancelable and expire on various dates through 2028. Rent expense under all operating leases for 2009, 2008
and 2007 was $303 million, $264 million and $223 million, respectively.
87