United Healthcare 2009 Annual Report Download - page 85
Download and view the complete annual report
Please find page 85 of the 2009 United Healthcare annual report below. You can navigate through the pages in the report by either clicking on the pages listed below, or by using the keyword search tool below to find specific information within the annual report.-
 1
1 -
2
-
3
-
4
-
5
-
6
-
7
-
8
-
9
-
10
-
11
-
12
-
13
-
14
-
15
-
16
-
17
-
18
-
19
-
20
-
21
-
22
-
23
-
24
-
25
-
26
-
27
-
28
-
29
-
30
-
31
-
32
-
33
-
34
-
35
-
36
-
37
-
38
-
39
-
40
-
41
-
42
-
43
-
44
-
45
-
46
-
47
-
48
-
49
-
50
-
51
-
52
-
53
-
54
-
55
-
56
-
57
-
58
-
59
-
60
-
61
-
62
-
63
-
64
-
65
-
66
-
67
-
68
-
69
-
70
-
71
-
72
-
73
-
74
-
 75
75 -
 76
76 -
 77
77 -
 78
78 -
 79
79 -
 80
80 -
 81
81 -
 82
82 -
 83
83 -
 84
84 -
 85
85 -
 86
86 -
 87
87 -
 88
88 -
 89
89 -
 90
90 -
 91
91 -
 92
92 -
 93
93 -
 94
94 -
 95
95 -
96
-
97
-
98
-
99
-
100
-
101
-
102
-
103
-
104
-
105
-
106
-
107
-
108
-
109
-
110
-
111
-
112
-
113
-
114
-
115
-
116
-
117
-
118
-
119
-
120
-
121
-
122
-
123
-
124
-
125
-
126
-
127
-
128
-
129
-
130
-
131
-
132
-
133
-
134
-
135
-
136
-
137
 |
 |

UNITEDHEALTH GROUP
NOTES TO THE CONSOLIDATED FINANCIAL STATEMENTS—(Continued)
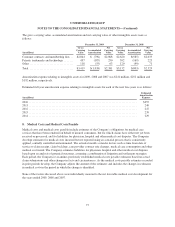
To determine compensation expense related to the Company’s stock options and SARs, the fair value of each
award is estimated on the date of grant using an option-pricing model. For purposes of estimating the fair value
of the Company’s employee stock option and SAR grants, the Company uses a binomial model. The principal
assumptions the Company used in applying the option-pricing models were as follows:
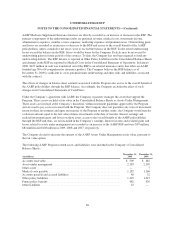
2009 2008 2007
Risk free interest rate ................................... 1.7% - 2.4% 2.2% - 3.4% 3.8% - 5.2%
Expected volatility ..................................... 41.3% - 46.8% 29.5% 24.2%
Expected dividend yield ................................. 0.1% 0.1% 0.1%
Forfeiture rate ......................................... 5.0% 5.0% 5.0%
Expected life in years ................................... 4.4-5.1 4.3 4.1
Risk-free interest rates are based on U.S. Treasury yields in effect at the time of grant. Expected volatilities are
based on the historical volatility of the Company’s common stock and the implied volatility from exchange-
traded options on the Company’s common stock. Beginning in 2009, the Company changed the weighting of
historical and implied volatilities used in the calculation of expected volatility to 90% and 10%, respectively.
Before the change, the Company had weighted historical and implied volatility equally. Due to the significant
economic turbulence and resulting instability of the exchange-traded options throughout 2008, the Company
concluded that they were no longer as representative of the fair value of its common stock over the expected life
of its options and SARs. The change had no impact on the Company’s reported Net Earnings nor Earnings per
Share. The Company uses historical data to estimate option and SAR exercises and forfeitures within the
valuation model. The expected lives of options and SARs granted represents the period of time that the awards
granted are expected to be outstanding based on historical exercise patterns.
The weighted-average grant date fair value of stock options and SARs granted for 2009, 2008 and 2007 was
approximately $10 per share, $9 per share and $14 per share. The total intrinsic value of stock options and SARs
exercised during 2009, 2008 and 2007 was $282 million, $244 million and $1.1 billion, respectively.
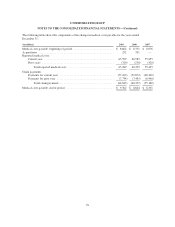
Restricted Shares
Restricted shares generally vest ratably over two to five years. Compensation expense related to restricted shares
is based on the share price on date of grant. Restricted share activity for the year ended December 31, 2009 is
summarized in the table below:
(shares in thousands) Shares
Weighted-
Average Grant
Date Fair Value
Nonvested, Beginning of Period ............................................ 6,282 $36
Granted ................................................................ 6,587 29
Vested ................................................................. (1,655) 29
Forfeited ............................................................... (594) 34
Nonvested, End of Period .................................................. 10,620 $33
The weighted-average grant date fair value of restricted shares granted during 2009, 2008 and 2007 was
approximately $29 per share, $34 per share and $51 per share, respectively. The total fair value of restricted
shares vested during 2009, 2008 and 2007 was $47 million, $17 million and $35 million, respectively.
83