United Healthcare 2009 Annual Report Download - page 48
Download and view the complete annual report
Please find page 48 of the 2009 United Healthcare annual report below. You can navigate through the pages in the report by either clicking on the pages listed below, or by using the keyword search tool below to find specific information within the annual report.-
 1
1 -
2
-
3
-
4
-
5
-
6
-
7
-
8
-
9
-
10
-
11
-
12
-
13
-
14
-
15
-
16
-
17
-
18
-
19
-
20
-
21
-
22
-
23
-
24
-
25
-
26
-
27
-
28
-
29
-
30
-
31
-
32
-
33
-
34
-
35
-
36
-
37
-
 38
38 -
 39
39 -
 40
40 -
 41
41 -
 42
42 -
 43
43 -
 44
44 -
 45
45 -
 46
46 -
 47
47 -
 48
48 -
 49
49 -
 50
50 -
 51
51 -
 52
52 -
 53
53 -
 54
54 -
 55
55 -
 56
56 -
 57
57 -
 58
58 -
59
-
60
-
61
-
62
-
63
-
64
-
65
-
66
-
67
-
68
-
69
-
70
-
71
-
72
-
73
-
74
-
75
-
76
-
77
-
78
-
79
-
80
-
81
-
82
-
83
-
84
-
85
-
86
-
87
-
88
-
89
-
90
-
91
-
92
-
93
-
94
-
95
-
96
-
97
-
98
-
99
-
100
-
101
-
102
-
103
-
104
-
105
-
106
-
107
-
108
-
109
-
110
-
111
-
112
-
113
-
114
-
115
-
116
-
117
-
118
-
119
-
120
-
121
-
122
-
123
-
124
-
125
-
126
-
127
-
128
-
129
-
130
-
131
-
132
-
133
-
134
-
135
-
136
-
137
 |
 |

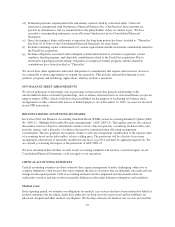
not reported using an actuarial process that is consistently applied, centrally controlled and automated. The
actuarial models consider factors such as time from date of service to claim receipt, claim backlogs, seasonal
variances in medical care consumption, health care professional contract rate changes, medical care utilization
and other medical cost trends, membership volume and demographics, benefit plan changes, and business mix
changes related to products, customers and geography. Depending on the health care professional and type of
service, the typical billing lag for services can be up to 90 days from the date of service. Substantially all claims
related to medical care services are known and settled within nine to twelve months from the date of service. We
estimate liabilities for physician, hospital and other medical cost disputes based upon an analysis of potential
outcomes, assuming a combination of litigation and settlement strategies.
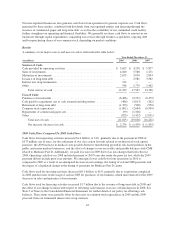
Each period, we re-examine previously established medical costs payable estimates based on actual claim
submissions and other changes in facts and circumstances. As more complete claim information becomes
available, we adjust the amount of the estimates and include the changes in estimates in medical costs in the
period in which the change is identified. In every reporting period, our operating results include the effects of
more completely developed medical costs payable estimates associated with previously reported periods. If the
revised estimate of prior period medical costs is less than the previous estimate, we will decrease reported
medical costs in the current period (favorable development). If the revised estimate of prior period medical costs
is more than the previous estimate, we will increase reported medical costs in the current period (unfavorable
development). Medical costs in 2009, 2008 and 2007, included net favorable medical cost development related to
prior periods of $310 million, $230 million and $420 million, respectively.
In developing our medical costs payable estimates, we apply different estimation methods depending on the
month for which incurred claims are being estimated. For example, we actuarially calculate completion factors
using an analysis of claim adjudication patterns over the most recent 36-month period. A completion factor is an
actuarial estimate, based upon historical experience, of the percentage of incurred claims during a given period
that have been adjudicated by us at the date of estimation. For months prior to the most recent three months, we
apply the completion factors to actual claims adjudicated-to-date to estimate the expected amount of ultimate
incurred claims for those months. For the most recent three months, we estimate claim costs incurred primarily
by applying observed medical cost trend factors to the average per member per month (PMPM) medical costs
incurred in prior months for which more complete claim data is available, supplemented by a review of near-term
completion factors. Medical cost trend factors are developed through a comprehensive analysis of claims
incurred in prior months and by reviewing a broad set of health care utilization indicators including, but not
limited to, pharmacy utilization trends, inpatient hospital census data and incidence data from the National
Centers for Disease Control. This approach is consistently applied from period to period.
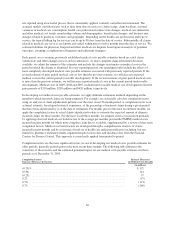
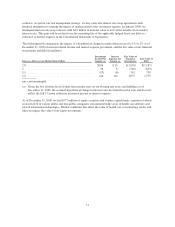
Completion factors are the most significant factors we use in developing our medical costs payable estimates for
older periods, generally periods prior to the most recent three months. The following table illustrates the
sensitivity of these factors and the estimated potential impact on our medical costs payable estimates for those
periods as of December 31, 2009:
Completion Factors
Increase (Decrease) in Factors
Increase (Decrease)
in Medical Costs Payable
(in millions)
(0.75)% ................................................................. $171
(0.50) ................................................................... 114
(0.25) ................................................................... 57
0.25 .................................................................... (57)
0.50 .................................................................... (113)
0.75 .................................................................... (169)
46