United Healthcare 2009 Annual Report Download - page 43
Download and view the complete annual report
Please find page 43 of the 2009 United Healthcare annual report below. You can navigate through the pages in the report by either clicking on the pages listed below, or by using the keyword search tool below to find specific information within the annual report.-
 1
1 -
2
-
3
-
4
-
5
-
6
-
7
-
8
-
9
-
10
-
11
-
12
-
13
-
14
-
15
-
16
-
17
-
18
-
19
-
20
-
21
-
22
-
23
-
24
-
25
-
26
-
27
-
28
-
29
-
30
-
31
-
32
-
 33
33 -
 34
34 -
 35
35 -
 36
36 -
 37
37 -
 38
38 -
 39
39 -
 40
40 -
 41
41 -
 42
42 -
 43
43 -
 44
44 -
 45
45 -
 46
46 -
 47
47 -
 48
48 -
 49
49 -
 50
50 -
 51
51 -
 52
52 -
 53
53 -
54
-
55
-
56
-
57
-
58
-
59
-
60
-
61
-
62
-
63
-
64
-
65
-
66
-
67
-
68
-
69
-
70
-
71
-
72
-
73
-
74
-
75
-
76
-
77
-
78
-
79
-
80
-
81
-
82
-
83
-
84
-
85
-
86
-
87
-
88
-
89
-
90
-
91
-
92
-
93
-
94
-
95
-
96
-
97
-
98
-
99
-
100
-
101
-
102
-
103
-
104
-
105
-
106
-
107
-
108
-
109
-
110
-
111
-
112
-
113
-
114
-
115
-
116
-
117
-
118
-
119
-
120
-
121
-
122
-
123
-
124
-
125
-
126
-
127
-
128
-
129
-
130
-
131
-
132
-
133
-
134
-
135
-
136
-
137
 |
 |
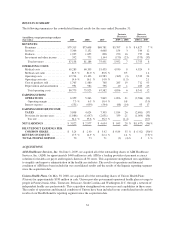
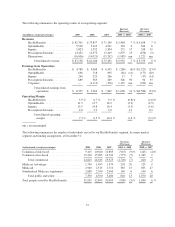
Prescription Solutions
The decreased Prescription Solutions revenues were primarily due to the reduction in the number of individuals
served related to the reassignment of dual-eligible beneficiaries described above through Medicare Part D
prescription drug plans by our Ovations business, and a shift from name brand pharmaceuticals towards generic
utilization, partially offset by revenues related to the Fiserv Health acquisition and growth in business with
unaffiliated clients. Intersegment revenues eliminated in consolidation were $11.0 billion and $12.4 billion for
2008 and 2007, respectively.
Prescription Solutions earnings from operations increased primarily due to the Fiserv Health acquisition, gains in
mail service drug fulfillment, and a continuing favorable mix shift to generic pharmaceuticals.
LIQUIDITY, FINANCIAL CONDITION AND CAPITAL RESOURCES
Liquidity
Introduction
We manage our liquidity and financial position in the context of our overall business strategy. We continually
forecast and manage our cash, investments, working capital balances and capital structure to meet the short- and
long-term obligations of our business while maintaining liquidity and financial flexibility. Cash flows generated
from operating activities are principally from earnings before depreciation, amortization and other non-cash
expenses. As a result, any future decline in our profitability may have a negative impact on our liquidity. The
diversity of our businesses, our geographic and customer diversity and our disciplined underwriting and pricing
processes for our risk-based businesses, which seek to match premium rate increases with future expected
medical costs, partially mitigates the risk of rising medical and operating costs.
Our regulated subsidiaries generate significant cash flows from operations. A majority of the assets held by our
regulated subsidiaries are in the form of cash, cash equivalents and investments. After considering expected cash
flows from operating activities, we generally invest cash of regulated subsidiaries that exceeds our expected
short-term obligations in longer term, investment-grade, marketable debt securities to improve our overall
investment return. We make these investments pursuant to our Board of Directors’ approved investment policy,
which focuses on preservation of capital, credit quality, diversification, income and duration. The policy also
generally governs return objectives, regulatory limitations, tax implications and risk tolerances.
Our regulated subsidiaries are subject to regulations and standards in their respective states of domicile. Most of
these regulations and standards conform to those established by the National Association of Insurance
Commissioners. These standards, among other things, require these subsidiaries to maintain specified levels of
statutory capital, as defined by each state, and restrict the timing and amount of dividends and other distributions
that may be paid to their parent companies. Except in the case of extraordinary dividends, these standards
generally permit dividends to be paid from statutory unassigned surplus of the regulated subsidiary and are
limited based on the regulated subsidiary’s level of statutory net income and statutory capital and surplus. These
dividends are referred to as “ordinary dividends” and generally can be paid without prior regulatory approval. If
the dividend, together with other dividends paid within the preceding twelve months, exceeds a specified
statutory limit or is paid from sources other than earned surplus, it is generally considered an “extraordinary
dividend” and must receive prior regulatory approval.
In 2009, based on the 2008 statutory net income and statutory capital and surplus levels, the maximum amount of
ordinary dividends that could be paid was $3.1 billion. For the year ended December 31, 2009, our regulated
subsidiaries paid their parent companies dividends of $4.2 billion, including $2.5 billion of extraordinary
dividends. For the year ended December 31, 2008, our regulated subsidiaries paid their parent companies
dividends of $4.2 billion, including $1.2 billion of extraordinary dividends. The increase in the proportion of
extraordinary dividends to total dividends in 2009 primarily reflects the acceleration of dividend timing, as well
as the size of specific dividends beyond ordinary levels. Given expected statutory capital levels, we anticipate
lower overall regulated subsidiary dividends in 2010.
41