United Healthcare 2008 Annual Report Download - page 94
Download and view the complete annual report
Please find page 94 of the 2008 United Healthcare annual report below. You can navigate through the pages in the report by either clicking on the pages listed below, or by using the keyword search tool below to find specific information within the annual report.-
 1
1 -
2
-
3
-
4
-
5
-
6
-
7
-
8
-
9
-
10
-
11
-
12
-
13
-
14
-
15
-
16
-
17
-
18
-
19
-
20
-
21
-
22
-
23
-
24
-
25
-
26
-
27
-
28
-
29
-
30
-
31
-
32
-
33
-
34
-
35
-
36
-
37
-
38
-
39
-
40
-
41
-
42
-
43
-
44
-
45
-
46
-
47
-
48
-
49
-
50
-
51
-
52
-
53
-
54
-
55
-
56
-
57
-
58
-
59
-
60
-
61
-
62
-
63
-
64
-
65
-
66
-
67
-
68
-
69
-
70
-
71
-
72
-
73
-
74
-
75
-
76
-
77
-
78
-
79
-
80
-
81
-
82
-
83
-
 84
84 -
 85
85 -
 86
86 -
 87
87 -
 88
88 -
 89
89 -
 90
90 -
 91
91 -
 92
92 -
 93
93 -
 94
94 -
 95
95 -
 96
96 -
 97
97 -
 98
98 -
 99
99 -
 100
100 -
 101
101 -
 102
102 -
 103
103 -
 104
104 -
105
-
106
-
107
-
108
-
109
-
110
-
111
-
112
-
113
-
114
-
115
-
116
-
117
-
118
-
119
-
120
-
121
-
122
-
123
-
124
-
125
-
126
-
127
-
128
-
129
-
130
-
131
-
132
 |
 |

UNITEDHEALTH GROUP
NOTES TO THE CONSOLIDATED FINANCIAL STATEMENTS—(Continued)
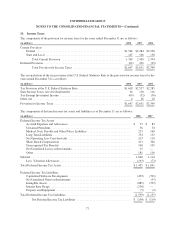
The following AARP Program-related assets and liabilities were included in the Company’s Consolidated
Balance Sheets at December 31:
(in millions) 2008 2007
Accounts Receivable ........................................................... $ 482 $ 459
Assets Under Management ...................................................... 2,199 2,176
Other Assets ................................................................. 7 —
Medical Costs Payable ......................................................... 1,160 1,109
Accounts Payable and Accrued Liabilities .......................................... 52 33
Other Policy Liabilities ......................................................... 1,047 1,132
Future Policy Benefits .......................................................... 429 —
Unearned Premiums ........................................................... — 361
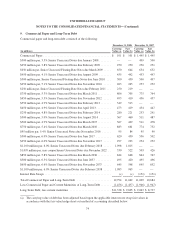
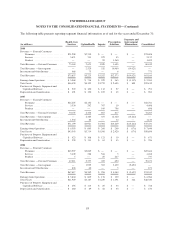
At December 31, 2008, the fair value of cash, cash equivalents and investments associated with the Program,
included in Assets Under Management, and the fair value of Other Assets were classified in accordance with the
fair value hierarchy as discussed in Note 5 of Notes to the Consolidated Financial Statements and were as
follows:
(in millions)
Quoted Prices
in Active
Markets
(Level 1)
Other
Observable
Inputs
(Level 2)
Unobservable
Inputs
(Level 3)
Total Fair
Value
Cash and Cash Equivalents ........................... $240 $ 18 $— $ 258
Debt Securities:
U.S. Government and Direct Agency obligations ...... 291 293 — 584
State and Municipal obligations ................... — 6 — 6
Corporate obligations ........................... — 786 — 786
Mortgage-backed securities (a) .................... — 563 — 563
Total Debt Securities ................................ 291 1,648 — 1,939
Equity Securities — Available-for-Sale ................. — 2 — 2
Total Cash and Investments ........................... 531 1,668 — 2,199
Other Assets ....................................... — — 7 7
Total Assets at Fair Value ............................ $531 $1,668 $ 7 $2,206
(a) Includes Agency-backed mortgage pass-through securities.
84