United Healthcare 2008 Annual Report Download - page 65
Download and view the complete annual report
Please find page 65 of the 2008 United Healthcare annual report below. You can navigate through the pages in the report by either clicking on the pages listed below, or by using the keyword search tool below to find specific information within the annual report.-
 1
1 -
2
-
3
-
4
-
5
-
6
-
7
-
8
-
9
-
10
-
11
-
12
-
13
-
14
-
15
-
16
-
17
-
18
-
19
-
20
-
21
-
22
-
23
-
24
-
25
-
26
-
27
-
28
-
29
-
30
-
31
-
32
-
33
-
34
-
35
-
36
-
37
-
38
-
39
-
40
-
41
-
42
-
43
-
44
-
45
-
46
-
47
-
48
-
49
-
50
-
51
-
52
-
53
-
54
-
 55
55 -
 56
56 -
 57
57 -
 58
58 -
 59
59 -
 60
60 -
 61
61 -
 62
62 -
 63
63 -
 64
64 -
 65
65 -
 66
66 -
 67
67 -
 68
68 -
 69
69 -
 70
70 -
 71
71 -
 72
72 -
 73
73 -
 74
74 -
 75
75 -
76
-
77
-
78
-
79
-
80
-
81
-
82
-
83
-
84
-
85
-
86
-
87
-
88
-
89
-
90
-
91
-
92
-
93
-
94
-
95
-
96
-
97
-
98
-
99
-
100
-
101
-
102
-
103
-
104
-
105
-
106
-
107
-
108
-
109
-
110
-
111
-
112
-
113
-
114
-
115
-
116
-
117
-
118
-
119
-
120
-
121
-
122
-
123
-
124
-
125
-
126
-
127
-
128
-
129
-
130
-
131
-
132
 |
 |

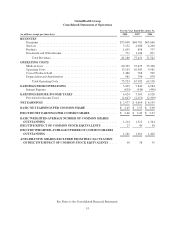
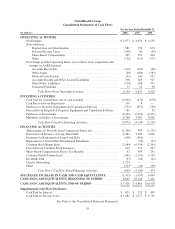
UnitedHealth Group
Consolidated Statements of Cash Flows
For the Year Ended December 31,
(in millions) 2008 2007 2006
OPERATING ACTIVITIES
Net Earnings ................................................... $2,977 $ 4,654 $ 4,159
Noncash Items:
Depreciation and Amortization ................................. 981 796 670
Deferred Income Taxes ....................................... (166) 86 (96)
Share-Based Compensation ................................... 305 505 404
Other ..................................................... (122) (213) (171)
Net Change in Other Operating Items, net of effects from acquisitions and
changes in AARP balances:
Accounts Receivable ......................................... (219) (194) (28)
Other Assets ............................................... (48) (386) (383)
Medical Costs Payable ....................................... (41) 149 597
Accounts Payable and Other Accrued Liabilities ................... 708 269 947
Other Policy Liabilities ....................................... (170) 188 337
Unearned Premiums ......................................... 33 23 90
Cash Flows From Operating Activities ...................... 4,238 5,877 6,526
INVESTING ACTIVITIES
Cash Paid for Acquisitions, net of cash assumed ....................... (4,012) (270) (670)
Cash Received from Disposition ................................... 199 8 —
Purchases of Property, Equipment and Capitalized Software ............. (791) (871) (728)
Proceeds from Disposal of Property, Equipment and Capitalized Software . . 185 — 52
Purchases of Investments ......................................... (9,251) (6,379) (4,851)
Maturities and Sales of Investments ................................. 8,598 3,365 4,096
Cash Flows Used For Investing Activities .................... (5,072) (4,147) (2,101)
FINANCING ACTIVITIES
(Repayments of) Proceeds from Commercial Paper, net ................. (1,346) 947 (2,332)
Proceeds from Issuance of Long-Term Debt .......................... 2,981 3,582 3,000
Payments for Retirement of Long-Term Debt ......................... (500) (950) —
Repayments of Convertible Subordinated Debentures ................... — (10) (91)
Common Stock Repurchases ...................................... (2,684) (6,599) (2,345)
Proceeds from Common Stock Issuances ............................. 299 712 397
Share-Based Compensation Excess Tax Benefits ...................... 62 303 241
Customer Funds Administered ..................................... (461) (1,110) 1,705
Dividends Paid ................................................. (37) (40) (41)
Checks Outstanding ............................................. 1,224 — —
Other ......................................................... (143) (20) (60)
Cash Flows (Used For) From Financing Activities ............. (605) (3,185) 474
(DECREASE) INCREASE IN CASH AND CASH EQUIVALENTS ........ (1,439) (1,455) 4,899
CASH AND CASH EQUIVALENTS, BEGINNING OF PERIOD .......... 8,865 10,320 5,421
CASH AND CASH EQUIVALENTS, END OF PERIOD ................. $7,426 $ 8,865 $10,320
Supplemental Cash Flow Disclosures
Cash Paid for Interest ............................................ $ 621 $ 553 $ 409
Cash Paid for Income Taxes ....................................... $1,882 $ 2,277 $ 1,729
See Notes to the Consolidated Financial Statements.
55