Under Armour 2012 Annual Report Download - page 42
Download and view the complete annual report
Please find page 42 of the 2012 Under Armour annual report below. You can navigate through the pages in the report by either clicking on the pages listed below, or by using the keyword search tool below to find specific information within the annual report.-
 1
1 -
2
-
3
-
4
-
5
-
6
-
7
-
8
-
9
-
10
-
11
-
12
-
13
-
14
-
15
-
16
-
17
-
18
-
19
-
20
-
21
-
22
-
23
-
24
-
25
-
26
-
27
-
28
-
29
-
30
-
31
-
 32
32 -
 33
33 -
 34
34 -
 35
35 -
 36
36 -
 37
37 -
 38
38 -
 39
39 -
 40
40 -
 41
41 -
 42
42 -
 43
43 -
 44
44 -
 45
45 -
 46
46 -
 47
47 -
 48
48 -
 49
49 -
 50
50 -
 51
51 -
 52
52 -
53
-
54
-
55
-
56
-
57
-
58
-
59
-
60
-
61
-
62
-
63
-
64
-
65
-
66
-
67
-
68
-
69
-
70
-
71
-
72
-
73
-
74
-
75
-
76
-
77
-
78
-
79
-
80
-
81
-
82
-
83
-
84
-
85
-
86
-
87
-
88
-
89
-
90
-
91
-
92
-
93
-
94
-
95
-
96
 |
 |

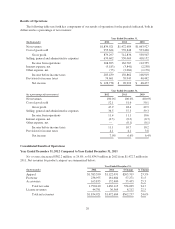
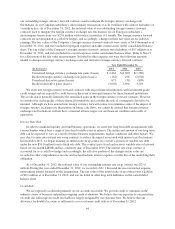
Operating income in our North American operating segment increased $46.6 million to $197.2 million in
2012 from $150.6 million in 2011 primarily due to the items discussed above in the Consolidated Results of
Operations. Operating income in other foreign countries decreased by $0.7 million to $11.5 million in 2012 from
$12.2 million in 2011 primarily due to higher costs associated with our continued investment to support our
international expansion in our EMEA operating segment, partially offset by unit sales growth and increased
license revenues from our Japanese licensee as discussed above.
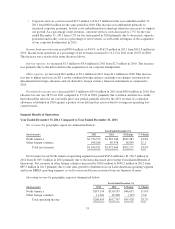
Year Ended December 31, 2011 Compared to Year Ended December 31, 2010
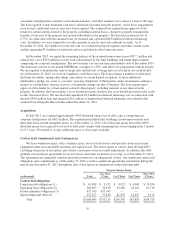
Net revenues by geographic region are summarized below:
Year Ended December 31,
(In thousands) 2011 2010 $ Change % Change
North America $1,383,346 $ 997,816 $385,530 38.6%
Other foreign countries 89,338 66,111 23,227 35.1
Total net revenues $1,472,684 $1,063,927 $408,757 38.4%
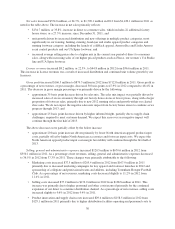
Net revenues in our North American operating segment increased $385.5 million to $1,383.3 million in
2011 from $997.8 million in 2010 primarily due to the items discussed above in the Consolidated Results of
Operations. Net revenues in other foreign countries increased by $23.2 million to $89.3 million in 2011 from
$66.1 million in 2010 primarily due to footwear shipments to our Dome licensee, as well as unit sales growth to
our distributors in our Latin American operating segment.
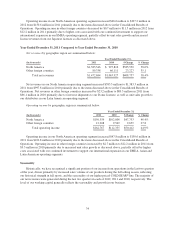
Operating income by geographic region is summarized below:
Year Ended December 31,
(In thousands) 2011 2010 $ Change % Change
North America $150,559 $102,806 $47,753 46.4%
Other foreign countries 12,208 9,549 2,659 27.8
Total operating income $162,767 $112,355 $50,412 44.9%
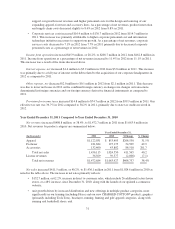
Operating income in our North American operating segment increased $47.8 million to $150.6 million in
2011 from $102.8 million in 2010 primarily due to the items discussed above in the Consolidated Results of
Operations. Operating income in other foreign countries increased by $2.7 million to $12.2 million in 2011 from
$9.5 million in 2010 primarily due to increased unit sales growth as discussed above, partially offset by higher
costs associated with our continued investment to support our international expansion in our EMEA, Asian and
Latin American operating segments.
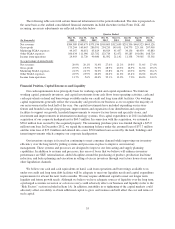
Seasonality
Historically, we have recognized a significant portion of our income from operations in the last two quarters
of the year, driven primarily by increased sales volume of our products during the fall selling season, reflecting
our historical strength in fall sports, and the seasonality of our higher priced COLDGEAR®line. The majority of
our net revenues were generated during the last two quarters in each of 2012, 2011 and 2010, respectively. The
level of our working capital generally reflects the seasonality and growth in our business.
34